A classification tree is being constructed to predict if an insurance policy will lapse. A random sample of 100 policies contains 30 that lapsed. You are considering two splits:
Split 1: One node has 20 observations with 12 lapses and one node has 80 observations with 18 lapses.
Split 2: One node has 10 observations with 8 lapses and one node has 90 observations with 22 lapses.
The total Gini index after a split is the weighted average of the Gini index at each node, with the weights proportional to the number of observations in each node. The total entropy after a split is the weighted average of the entropy at each node, with the weights proportional to the number of observations in each node.
Determine which of the following statements is/are true?
- Split 1 is preferred based on the total Gini index.
- Split 1 is preferred based on the total entropy.
- Split 1 is preferred based on having fewer classification errors.
- I only
- II only
- III only
- I, II, and III
- The correct answer is not given by (A), (B), (C), or (D).
Determine which of the following statements concerning decision tree pruning is/are true.
- The recursive binary splitting method can lead to overfitting the data.
- A tree with more splits tends to have lower variance.
- When using the cost complexity pruning method, α = 0 results in a very large tree
- None
- I and II only
- I and III only
- II and III only
- The correct answer is not given by (A), (B), (C), or (D).
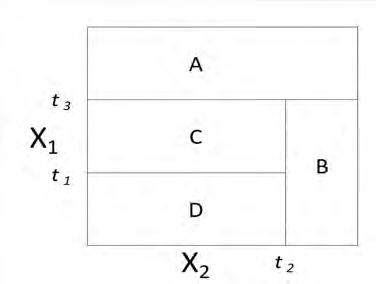
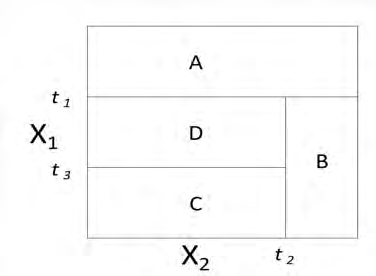
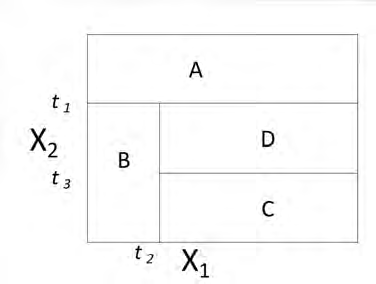
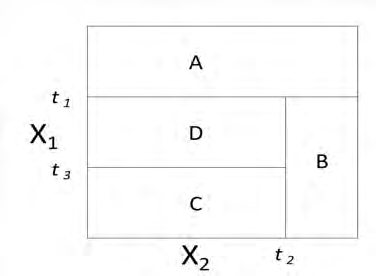
Each picture below represents a two-dimensional space where observations are classified into two categories. The categories are representing by light and dark shading. A classification tree is to be constructed for each space.
Determine which space can be modeled with no error by a classification tree.
- I only
- II only
- III only
- I, II, and III
- The correct answer is not given by (A), (B), (C), or (D).
Determine which of the following considerations may make decision trees preferable to other statistical learning methods.
- Decision trees are easily interpretable.
- Decision trees can be displayed graphically.
- Decision trees are easier to explain than linear regression methods.
- None
- I and II only
- I and III only
- II and III only
- The correct answer is not given by (A), (B), (C), or (D).
The regression tree shown below was produced from a dataset of auto claim payments. Age Category (agecat: 1, 2, 3, 4, 5, 6) and Vehicle Age (veh_age: 1, 2,3,4) are both predictor variables, and log of claim amount (LCA) is the dependent variable.
Consider three autos I, II, III:
- An Auto in Age Category 1 and Vehicle Age 4
- An Auto in Age Category 5 and Vehicle Age 5
- An Auto in Age Category 5 and Vehicle Age 3
Rank the estimated LCA of Autos I, II, and
- LCA(I) < LCA(II) < LCA(III)
- LCA(I) < LCA(III) < LCA(II)
- LCA(II) < LCA(I) < LCA(III)
- LCA(II) < LCA(III) < LCA(I)
- LCA(III) < LCA(II) < LCA(I)
You are given the following regression tree predicting the weight of ducks in kilograms (kg):
You predict the weight of the following three ducks:
X: Wing Span = 5.5 cm, Male, Age = 7 years
Y: Wing Span = 5.8 cm, Female, Age = 5 years
Z: Wing Span = 5.7 cm, Male, Age = 8 years
Determine the order of the predicted weights of the three ducks.
- X<Y<Z
- X<Z<Y
- Y<X<Z
- Y<Z<X
- Z<X<Y
You have constructed the following regression tree predicting unit sales (in thousands) of car seats. The variable ShelveLoc has possible values Good, Medium, and Bad.
| Variable | Observed Value |
|---|---|
| ShelveLoc | Good |
| Price | 120 |
| Age | 57 |
| Advertising | 12 |
Determine the predicted unit sales (in thousands) for the above observation based on the regression tree.
- 4.7
- 6.6
- 7.4
- 9.2
- 9.4
You are given:
- The following observed values of the response variable, R, and predictor variables X, Y, Z:
R 4.75 4.67 4.67 4.56 4.53 3.91 3.90 3.90 3.89 X M F M F M F F M M Y A A D D B C B D B Z 2 4 1 3 2 2 5 5 1 -
The following plot of the corresponding regression tree:
Calculate the Mean Response (MR) for each of the end nodes.
- MR(T1) = 4.39, MR(T2) = 4.38, MR(T3) = 4.29, MR(T4) = 3.90
- MR(T1) = 4.26, MR(T2) = 4.38,MR(T3) = 4.62, MR(T4) = 3.90
- MR(T1) = 4.26, MR(T2) = 4.39,MR(T3) = 3.90, MR(T4) = 4.29
- MR(T1) = 4.64, MR(T2) = 4.29,MR(T3) = 4.38, MR(T4) = 3.90
- MR(T1) = 4.64, MR(T2) = 4.38,MR(T3) = 4.39, MR(T4) = 3.90


