guide:E7ed92d7d3: Difference between revisions
No edit summary |
mNo edit summary |
||
| Line 33: | Line 33: | ||
</math></div> | </math></div> | ||
The slope of the tangent line to the graph of a function is one interpretation of the derivative, and the rate of change of <math>y</math> with respect to <math>x</math> is another. Both interpretations aid us in the sketching of graphs. A little practice will show that we need plot relatively few points for a sketch if we know the slope of the graph at each of these points. Let us consider the function <math>f</math> defined by | The slope of the tangent line to the graph of a function is one interpretation of the derivative, and the rate of change of <math>y</math> with respect to <math>x</math> is another. Both interpretations aid us in the sketching of graphs. A little practice will show that we need plot relatively few points for a sketch if we know the slope of the graph at each of these points. Let us consider the function <math>f</math> defined by | ||
| Line 108: | Line 107: | ||
[[File:guide_c5467_scanfig2_5.png | 400px | thumb | ]] | [[File:guide_c5467_scanfig2_5.png | 400px | thumb | ]] | ||
</div> | </div> | ||
'''Example''' | '''Example''' | ||
| Line 141: | Line 141: | ||
In the plotting of graphs of polynomial functions, we are frequently helped by knowing that a straight line can cut the graph of a polynomial function of the nth degree in at most n points. This is a consequence of the algebraic fact that, if <math>p(x)</math> is a polynomial function of degree <math>n</math>, then the equa | In the plotting of graphs of polynomial functions, we are frequently helped by knowing that a straight line can cut the graph of a polynomial function of the nth degree in at most n points. This is a consequence of the algebraic fact that, if <math>p(x)</math> is a polynomial function of degree <math>n</math>, then the equa | ||
tion <math>p(x) = 0</math> can have at most n distinct real roots. The function in Example 1 may be expanded to show that it is a polynomial of degree 4. It is possible to draw a straight line which will cut its graph in four points, but no straight line which will cut it in as many as five points. | tion <math>p(x) = 0</math> can have at most n distinct real roots. The function in Example 1 may be expanded to show that it is a polynomial of degree 4. It is possible to draw a straight line which will cut its graph in four points, but no straight line which will cut it in as many as five points. | ||
<span id="fig 2.7"/> | <span id="fig 2.7"/> | ||
'''Example''' | '''Example''' | ||
| Line 161: | Line 162: | ||
[[File:guide_c5467_scanfig2_8.png | 400px | thumb | ]] | [[File:guide_c5467_scanfig2_8.png | 400px | thumb | ]] | ||
</div> | </div> | ||
<span id="fig 2.9"/> | <span id="fig 2.9"/> | ||
'''Example''' | '''Example''' | ||
Sketch the graph of <math>f(x) = x + \frac{4}{x}</math>. The derivatives are | Sketch the graph of <math>f(x) = x + \frac{4}{x}</math>. The derivatives are | ||
| Line 196: | Line 199: | ||
</ul> | </ul> | ||
==General references== | ==General references== | ||
{{cite web |title=Crowell and Slesnick’s Calculus with Analytic Geometry|url=https://math.dartmouth.edu/~doyle/docs/calc/calc.pdf |last=Doyle |first=Peter G.|date=2008 |access-date=Oct 29, 2024}} | {{cite web |title=Crowell and Slesnick’s Calculus with Analytic Geometry|url=https://math.dartmouth.edu/~doyle/docs/calc/calc.pdf |last=Doyle |first=Peter G.|date=2008 |access-date=Oct 29, 2024}} | ||
Revision as of 01:39, 5 November 2024
The slope of the tangent line to the graph of a function is one interpretation of the derivative, and the rate of change of [math]y[/math] with respect to [math]x[/math] is another. Both interpretations aid us in the sketching of graphs. A little practice will show that we need plot relatively few points for a sketch if we know the slope of the graph at each of these points. Let us consider the function [math]f[/math] defined by
Its domain is [math]R[/math], and, for each real value of [math]x[/math], we find the corresponding value [math]f(x)[/math]. To help us make the sketch, we look at the derivative:
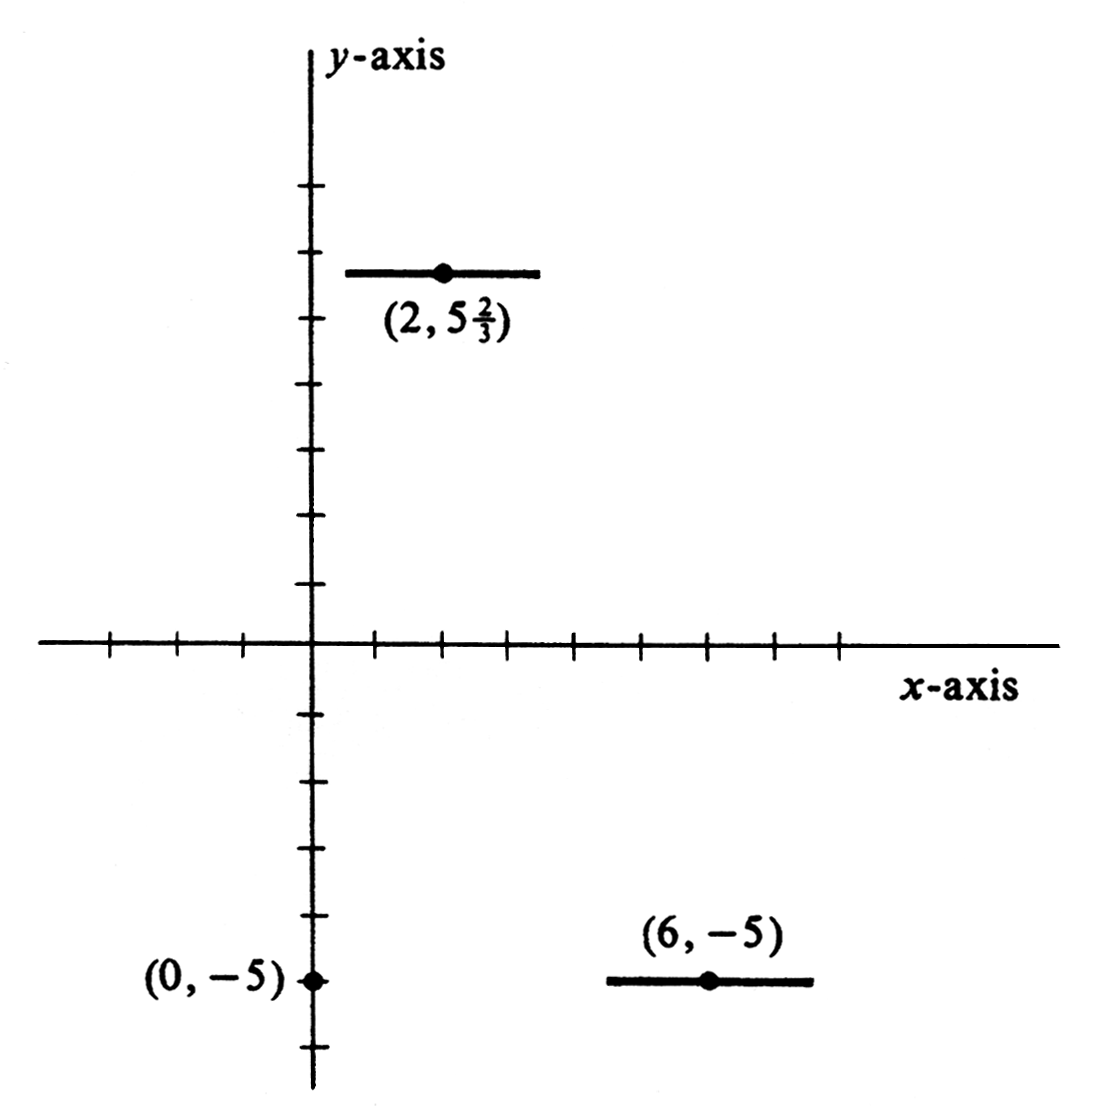
If [math]x \lt 2[/math], each of the factors of [math]f'(x)[/math] is negative, and hence their product is positive. Thus the first derivative is positive for each value of [math]x[/math] less than 2. With the rate-of-change interpretation, this means that the rate of change of [math]f[/math] with respect to [math]x[/math] is positive or that [math]f(x)[/math] increases whenever [math]x[/math] does. Thus, as [math]x[/math] increases from [math]-\infty[/math] to 2, [math]f(x)[/math] increases. The graph goes up as one moves to the right until [math]x = 2[/math]. If [math]x = 2[/math], then [math]f'(x) = 0[/math], and the tangent, having a slope of 0, is horizontal. If [math]2 \lt x \lt 6[/math], the first factor of [math]f'(x)[/math] is positive, the second factor is negative, and their product is negative. With a negative rate of change, [math]f(x)[/math] must decrease as [math]x[/math] increases. Thus, as [math]x[/math] increases from 2 to 6, [math]f(x)[/math] decreases. The graph goes down as one moves to the right from [math]x = 2[/math] to [math]x= 6[/math]. If [math]x = 6[/math], then [math]f'(x) = 0[/math], and the tangent to the graph is again horizontal. If [math]x \gt 6[/math], both factors of [math]f'(x)[/math] are positive, and hence their product is positive. Thus [math]f(x)[/math] increases as one goes to the right beyond [math]x = 6[/math]. Since [math]f(2) = \frac{1}{3} \cdot 8 - 4 \cdot 4 + 12 \cdot 2 - 5 = 5\frac{2}{3}[/math] and [math]f(6) = \frac{1}{3} \cdot 216 - 4 \cdot 36 + 12 \cdot 6 - 5 = 5\frac{2}{3}[/math], we plot the points [math](2, 5\frac{2}{3})[/math] and [math](6, -5)[/math]. At each of these points we sketch a horizontal line segment. An additional point may be found by inspection: Since [math]f(0) = -5[/math], the point [math](0, -5)[/math] is also plotted on Figure. We now know that the graph comes up from lower left through [math](0, -5)[/math] to [math](2, 5\frac{2}{3})[/math], goes down from [math](2, 5\frac{2}{3})[/math] to [math](6, -5)[/math], and then goes up to the right from [math](6, -5)[/math]. But we do not know its shape. Further information on this may be obtained from the second derivative:
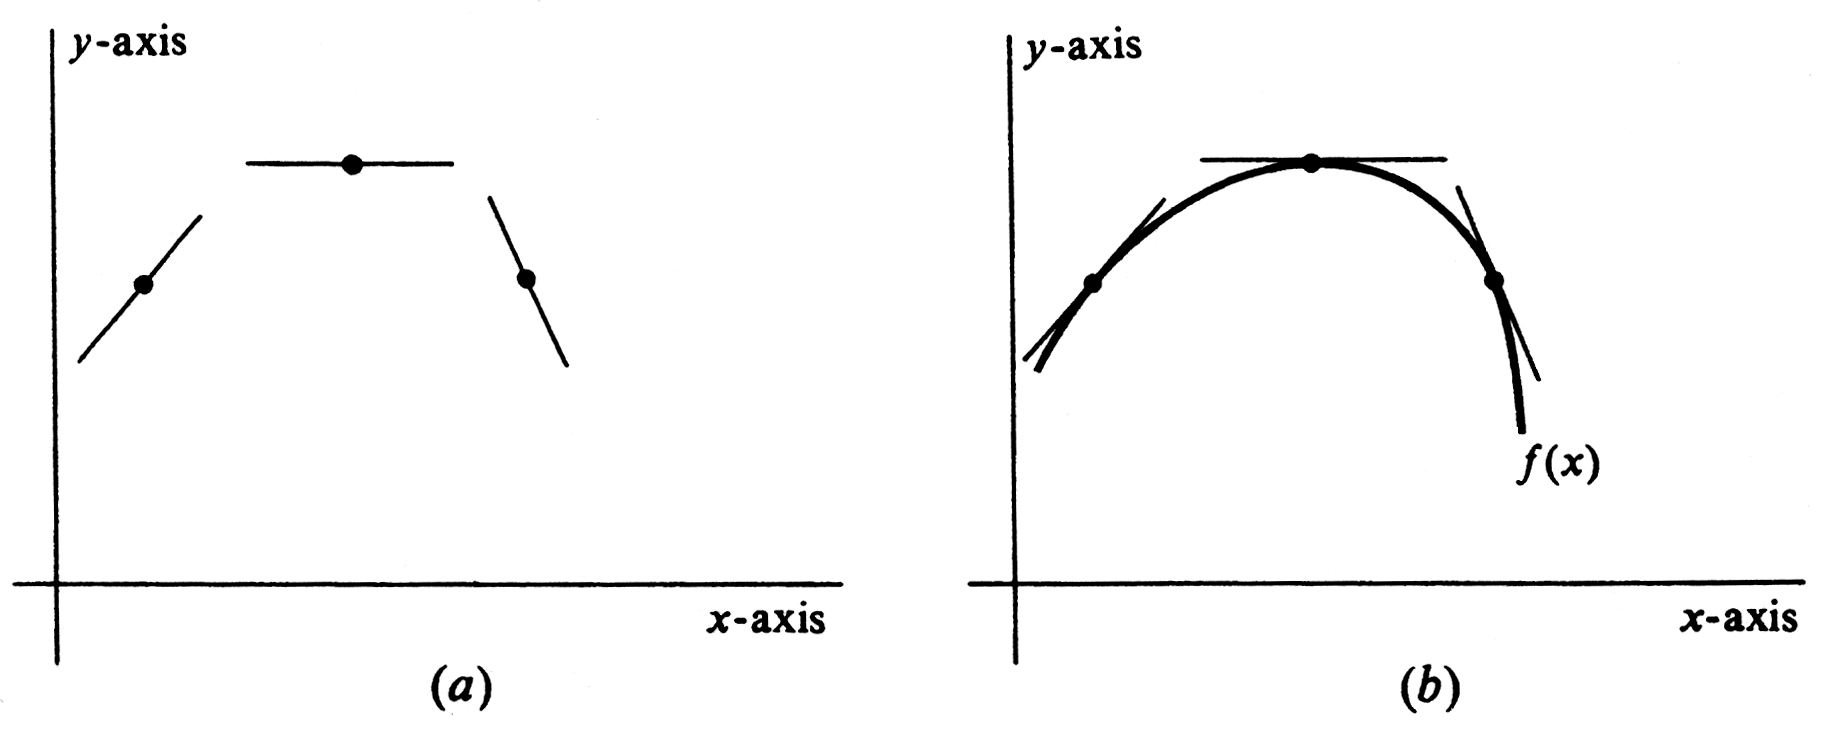
If [math]x \lt 4[/math], then [math]f''(x)[/math] is negative. Since [math]f''[/math] is the rate of change of [math]f'[/math] with respect to [math]x[/math], this means that [math]f'[/math] is decreasing as [math]x[/math] is increasing from [math]-\infty[/math] to 4. If we interpret [math]f'[/math] as the slope of the tangent, then this means that the slope of the tangent decreases as [math]x[/math] increases. We can get some idea of shape here if we plot three points on Figure(a), the middle one the highest and with a horizontal tangent drawn through it. Note that the tangent through the middle point has slope less than that of the tangent through the left point and that the tangent through the right point has a slope which is still less. The slopes of tangents at intermediate points will take on intermediate values, and thus a curve passing through these three points with these three tangents must be concave downward or must “bend” down. Whenever [math]f''(x) \lt 0[/math], the graph of [math]f(x)[/math] will be bending down. The part of the curve through the three points of Figure(a) with the appropriate tangents is drawn in Figure(b).
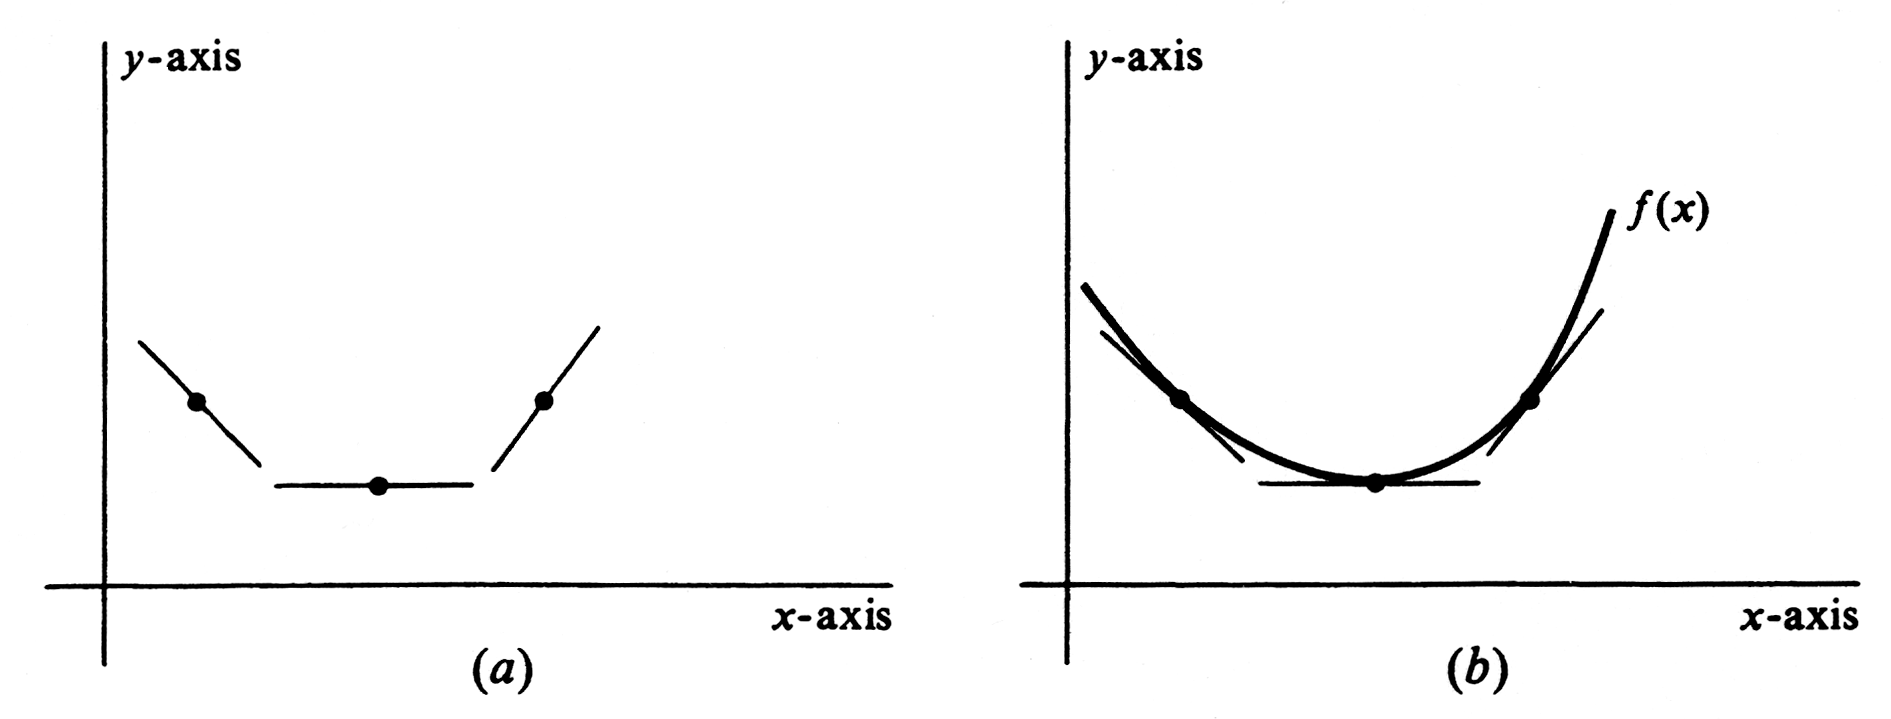
If [math]x = 4[/math], then [math]f''(x) = 0[/math], and the rate of change of [math]f'[/math] with respect to [math]x[/math] is 0. Thus the slope of the tangent has ceased decreasing. If [math]x \gt 4[/math], then [math]f''(x) \gt 0[/math], and [math]f'[/math] increases as [math]x[/math] increases. Thus the slope of the tangent increases as [math]x[/math] increases. Again we plot three points, the middle one the lowest and with a horizontal tangent drawn through it. These are shown in Figure(a). Since the slope increases as [math]x[/math] increases, the tangent through the middle point has slope greater than that of the tangent through the left point, and the tangent through the right point has a slope which is still greater. The slopes of tangents at intermediate points take on intermediate values, and thus a curve passing through these three points with these tangents must be concave upward or must “bend” up. Whenever [math]f''(x) \gt 0[/math], the graph of [math]f(x)[/math] will be bending up. The part of the curve through the three points of Figure(a) with the appropriate tangents is drawn in Figure(b).
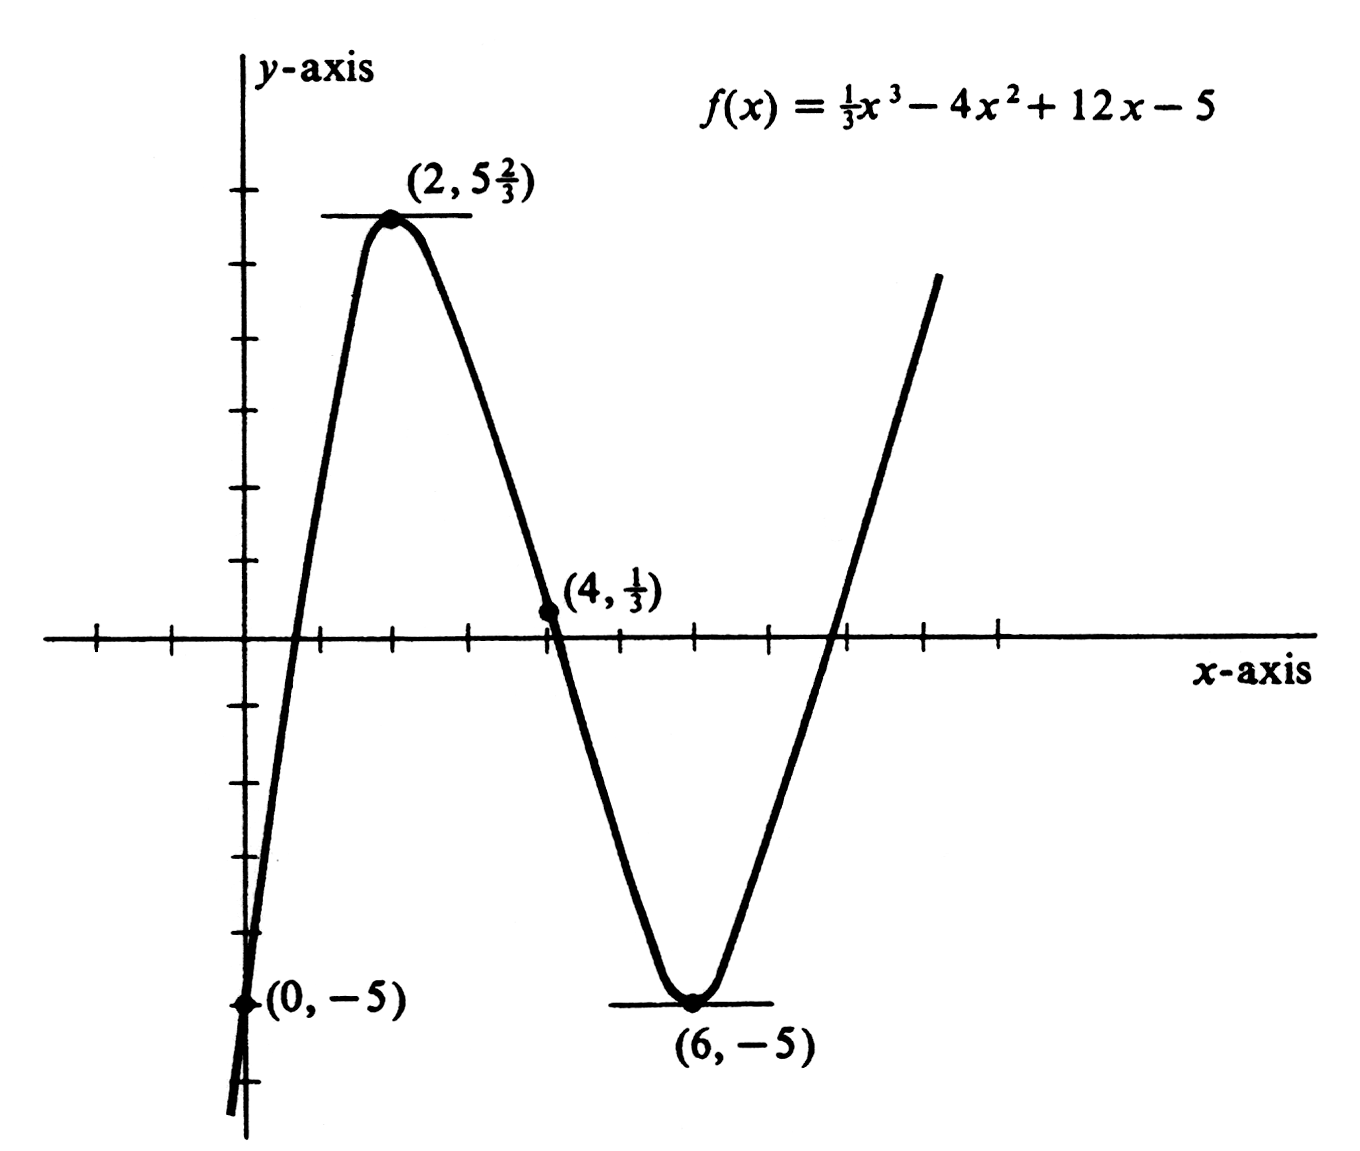
After finding that [math]f(4) = \frac{1}{3} \cdot 64 - 4 \cdot 16 + 12 \cdot 4 - 5 = \frac{1}{3}[/math], we are ready to sketch the graph in Figure. The graph is concave downward from the far left through [math](0, -5)[/math] to a high point at [math](2, 5\frac{2}{3})[/math] and on to [math](4, \frac{1}{3})[/math]. It is then concave upward from [math](4, \frac{1}{3})[/math] to a low point at [math](6, -5)[/math] and on upward to the right. The graph is, of course, incomplete, since it continues indefinitely both downward to the left and upward to the right. The point [math](2, 5\frac{2}{3})[/math], being higher than any nearby point on the graph, is called a local, or relative, maximum point. It is certainly not the highest point on the graph, hence the word “local,” or “relative.” Similarly, the point [math](6, -5)[/math] is a local, or relative, minimum.
In summary, the graph of a function is concave downward when the second derivative of the function is negative and concave upward when the second derivative of the function is positive. The graph has horizontal tangents when the first derivative is 0. The points where the tangent is horizontal may be local maximum points or local minimum points or, as we shall see in Example 1, points of horizontal inflection. It is important to understand clearly the definitions of the various expressions used in sketching graphs. The ordered pair [math](a,f(a))[/math] is a local maximum point or a local minimum point of the function [math]f[/math] if there is an open interval of the [math]x[/math]-axis containing a such that, for every number [math]x[/math] in that interval,
respectively. As we have indicated, the words relative maximum and relative minimum are also used. On the other hand, the pair [math](a, f(a))[/math] is an absolute maximum point if, for every [math]x[/math] in the domain of [math]f[/math],
and an absolute minimum point if
An extreme point is one that is either a maximum or minimum point (local or absolute). If [math](a, f(a))[/math] is an extreme point, we shall call [math]f(a)[/math] the extreme value of the function and shall say that the function has the extreme value at [math]a[/math]. For example, we say that the function [math]f[/math] in Figure has a local minimum value of [math]-5[/math] which occurs at [math]x = 6[/math]. However, this function has no absolute maximum or minimum points. Any point [math](a, f(a))[/math], where [math]f'(a) = 0[/math], is called a critical point of [math]f[/math]. A point of inflection is a point where the concavity changes sign. Thus [math](a,f(a))[/math] is a point of inflection of the function [math]f[/math] if there is an open interval on the[math]x[/math]-axis containing a such that, for any numbers [math]x_1[/math] and [math]x_2[/math] in that interval,
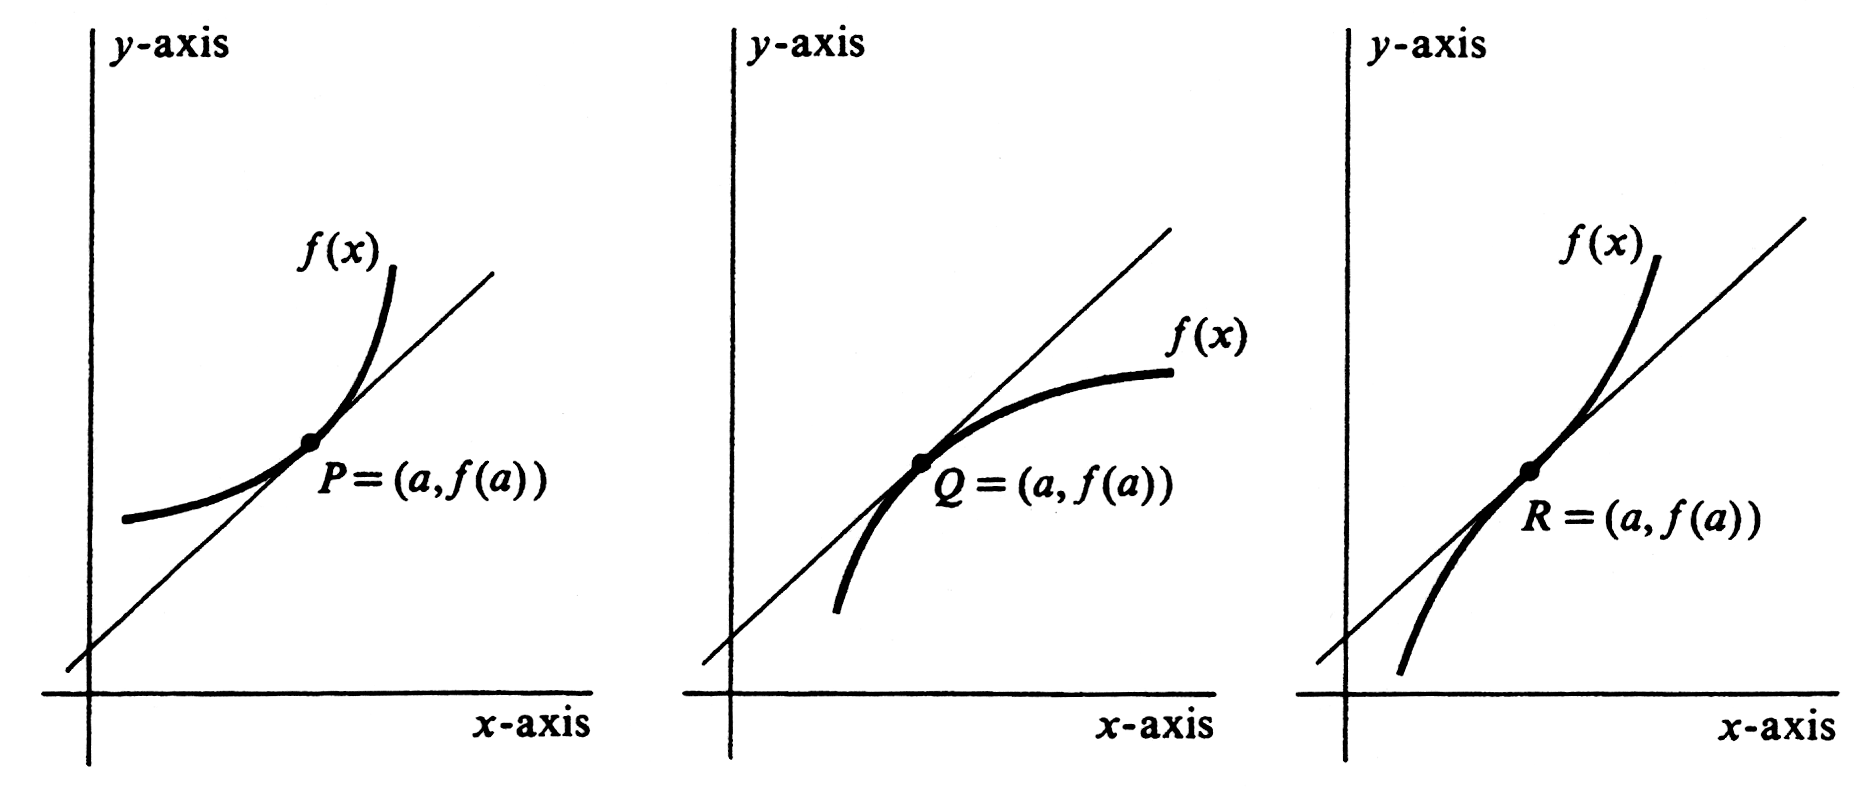
whenever [math]x_1 \lt a[/math] and [math]x_2 \gt a[/math]. The inequality (1) simply says that [math]f''(x_1)[/math] and [math]f''(x_2)[/math] are of opposite sign. A characteristic of a point of inflection of a function is that its tangent line crosses the graph of the function at that point. The different possibilities are illustrated in Figure. Of the points [math]P, Q[/math], and [math]R[/math], only [math]R[/math] is a point of inflection. If a function has a point of inflection $(a, f(a))$ and the second derivative $f(a)$ exists, then $f(a) = 0$. However, it is possible to have a point of inflection at a point where there is no second derivative (see Problem 10 at the end of this section). \medskip
Example
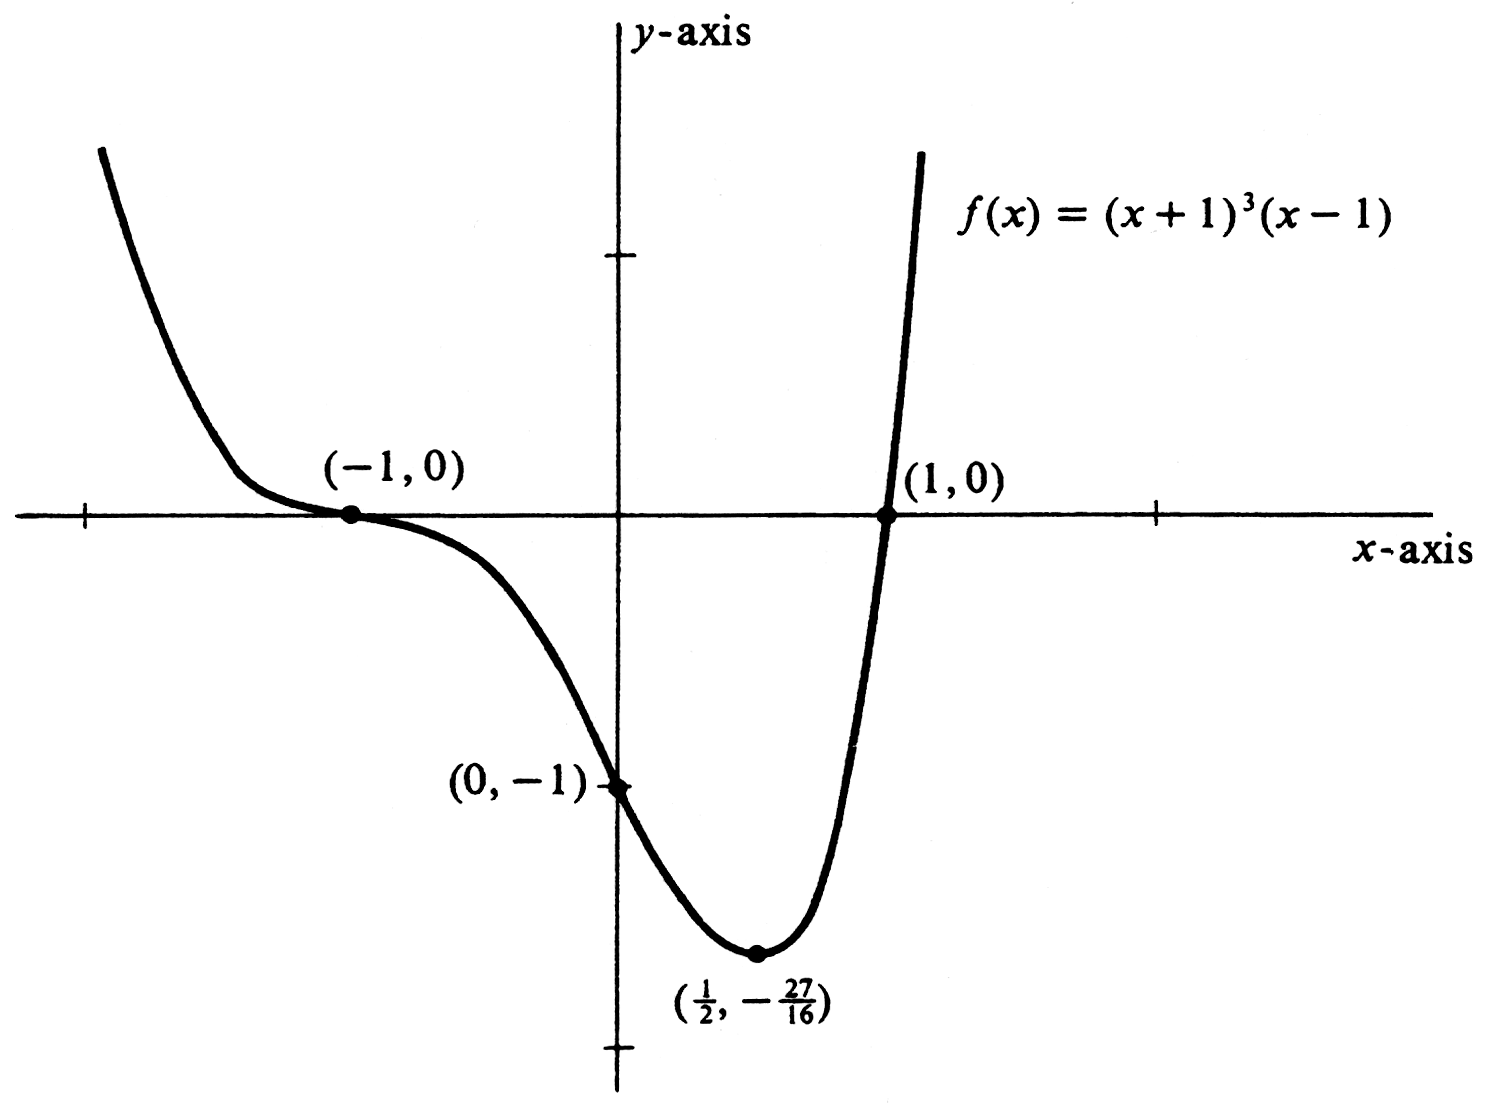
Sketch the graph of [math]f(x) = {(x + 1)^3}(x- 1)[/math]. We first compute the derivatives:
Setting [math]f'(x) = 0[/math], we obtain [math]x = -1[/math] and [math]x = \frac{1}{2}[/math]. Thus [math](-1, 0)[/math] and [math](\frac{1}{2}, -\frac{27}{16})[/math] are critical points and the tangents through these points are horizontal. Setting [math]f''(x) = 0[/math], we get solutions [math]x = -1[/math] and [math]x = 0[/math]. Thus, if there are any points of inflection, they must occur at these two places. It is easy to see that the sign of the second derivative for values of [math]x[/math] along the [math]x[/math]-axis follows the pattern
\begin{center} \begin{picture}(400,60)(0,0) \put(0,17){\line(20,0){200}} \put(60,17){\line(0,1){20}} \put(110,17){\line(0,1){20}} \put(15,22){positive} \put(120,22){positive} \put(70,22){negative} \put(60,5){-1} \put(110,5){0} \put(190,5){x-axis} \end{picture} \end{center} We conclude that [math](-1, 0)[/math] and [math](0, -1)[/math] are in fact points of inflection. The point [math](-1, 0)[/math], being both a critical point and a point of inflection, is a point of horizontal inflection. The graph is shown in Figure. Note that the graph crosses the tangent at the point of horizontal inflection and that the slope of the tangent line does not change sign at that point. The first derivative (hence the slope of the tangent) increases to zero, as we go from the left to [math]x = -1[/math] and then decreases again through negative values, from [math]x = -1[/math] to [math]x = 0[/math]. The point [math](\frac{1}{2}, -\frac{27}{16})[/math], being the lowest point on the graph, is not only a local minimum point but also an absolute minimum point. [math]-\frac{27}{16}[/math] is the absolute minimum value of this function. \medskip
In the plotting of graphs of polynomial functions, we are frequently helped by knowing that a straight line can cut the graph of a polynomial function of the nth degree in at most n points. This is a consequence of the algebraic fact that, if [math]p(x)[/math] is a polynomial function of degree [math]n[/math], then the equa tion [math]p(x) = 0[/math] can have at most n distinct real roots. The function in Example 1 may be expanded to show that it is a polynomial of degree 4. It is possible to draw a straight line which will cut its graph in four points, but no straight line which will cut it in as many as five points.
Example
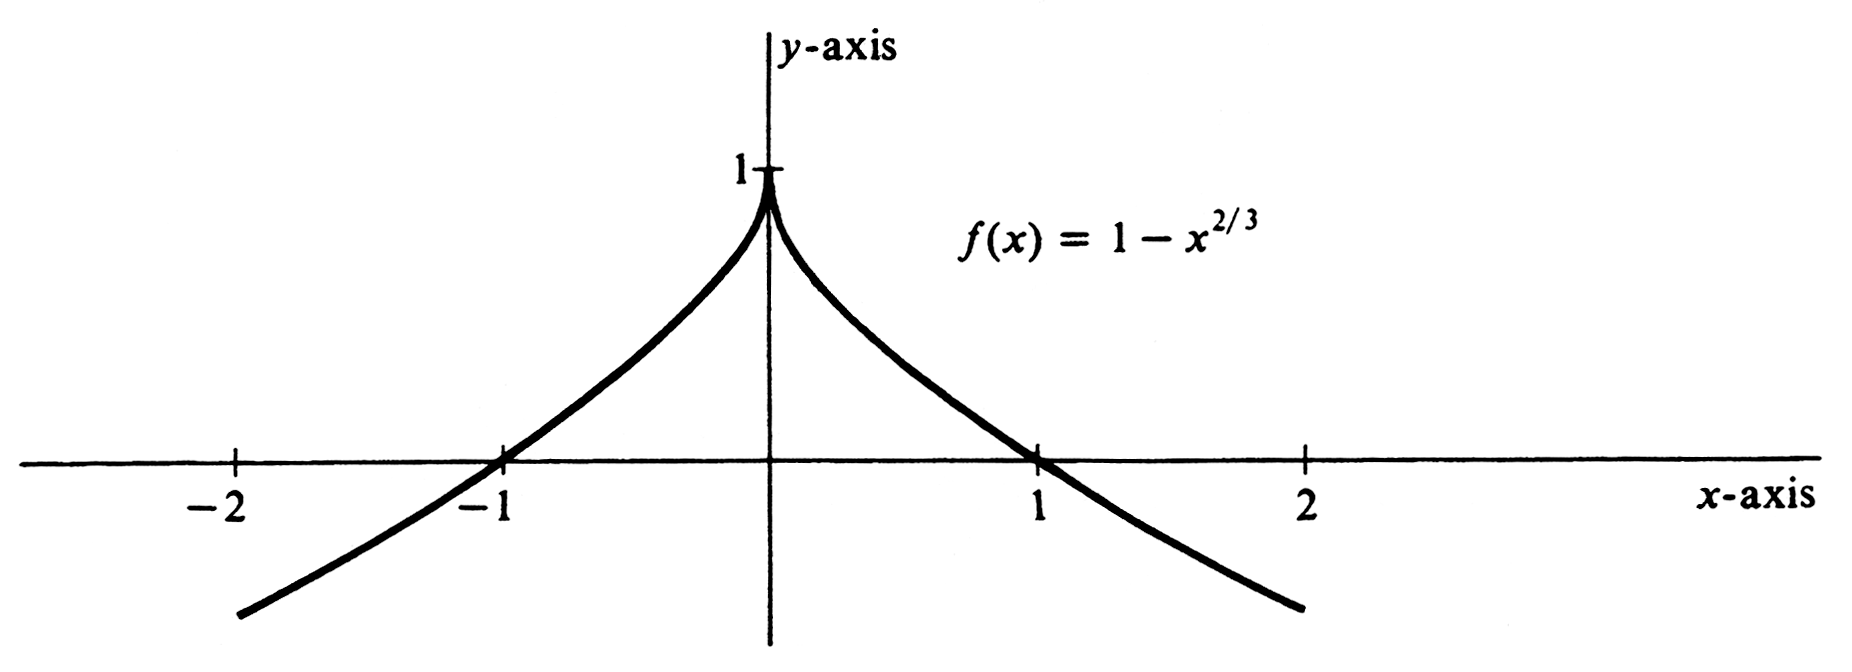
Sketch the graph of [math]f(x) = 1 - x^{2/3}[/math]. As before, we find derivatives:
For no values of [math]x[/math] will we have [math]f'(x) = 0[/math], and so there are no critical points. On the other hand, [math]f'(0)[/math] is not defined and the graph has a vertical tangent at (0, 1). The first derivative is defined for all other values of [math]x[/math] and is positive for [math]x \lt 0[/math] and negative for [math]x \gt 0[/math]. Thus, at each point on the graph to the left of the vertical axis, the slope of the tangent is positive, increasing without limit as [math]x \rightarrow 0-[/math]. At each point on the graph to the right of the vertical axis, the slope of the tangent is negative, increasing from negative numbers large in absolute value as [math]x[/math] increases from 0. The second derivative [math]f''(x)[/math] is positive for all values of [math]x[/math] except for [math]x = 0[/math], where it is not defined. It follows that there are no points of inflection. The graph is nowhere concave downward.
Note in Figure that the portion of the graph which lies to the right of the vertical axis is the “mirror reflection” across that axis of the portion which lies to the left of the vertical axis. Note also that [math]f(-x) = f(x)[/math]. Such a function, where [math]f(-x) = f(x)[/math], is called an even function and its graph will always contain two halves which can be brought into coincidence with each other by folding the graph along the vertical axis (Figure). The problem of graphing an even function is simplified by graphing it for positive values of [math]x[/math] and drawing, for negative values of [math]x[/math], a reflection over the vertical axis of the right half of the graph. \medskip
Example
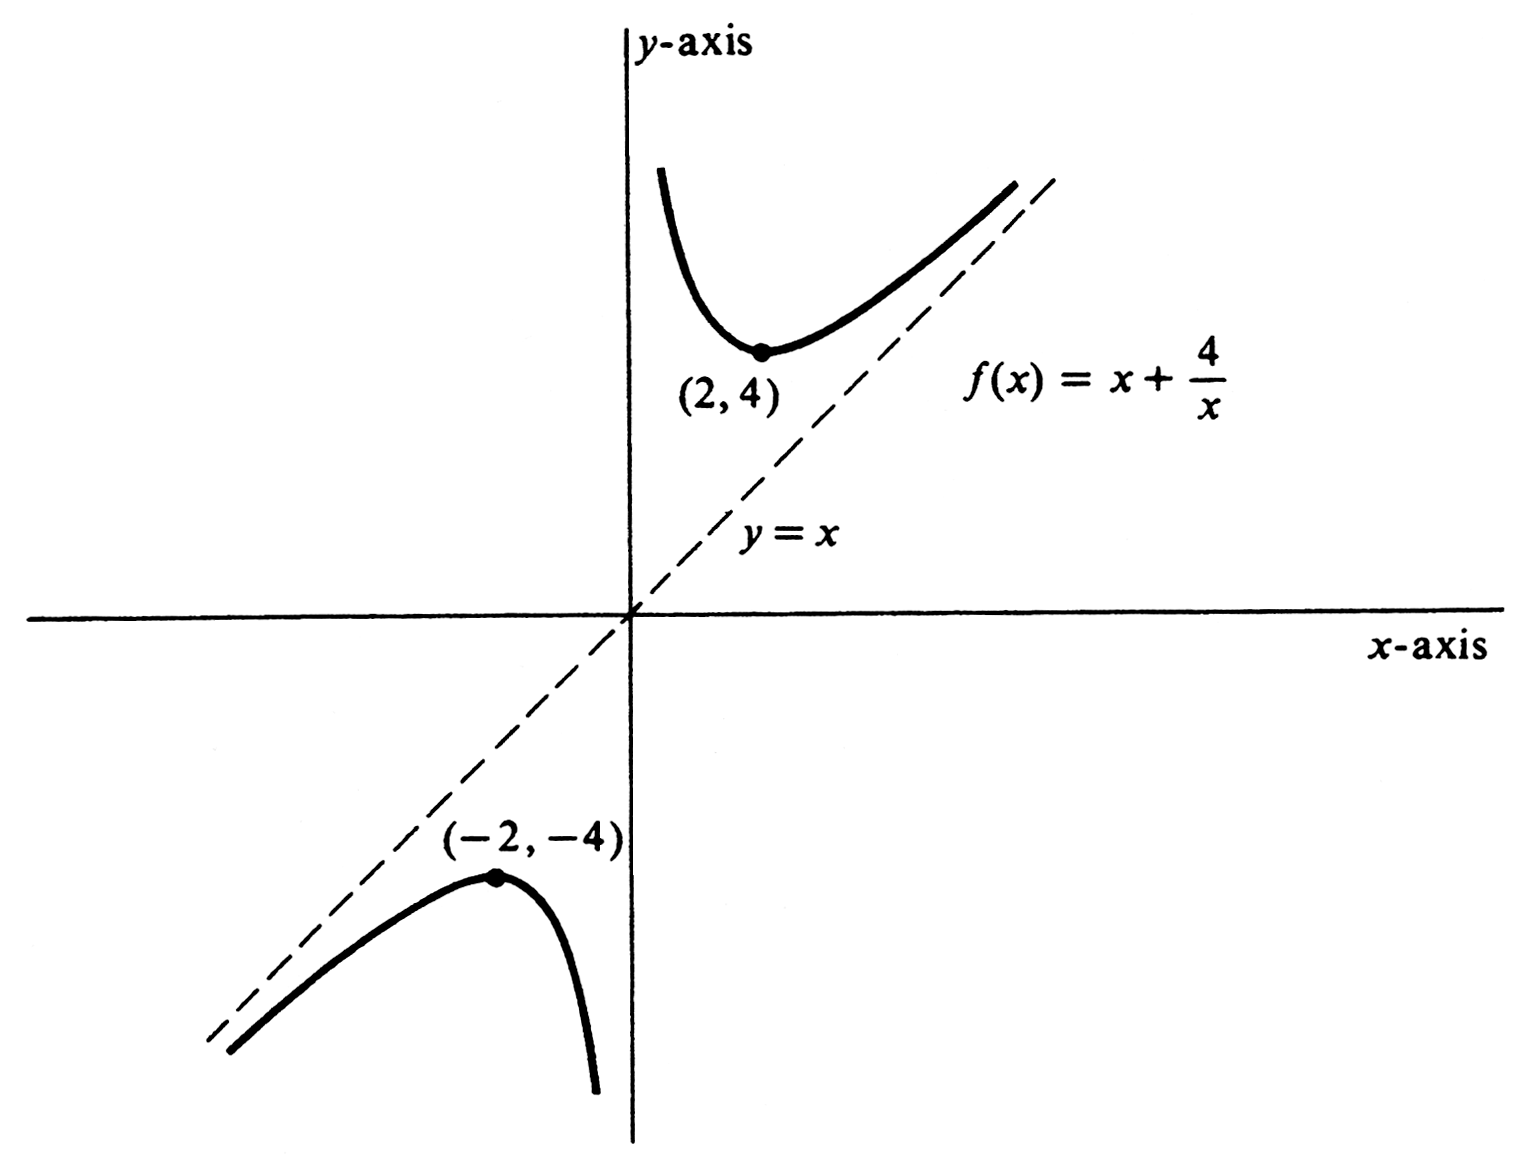
Sketch the graph of [math]f(x) = x + \frac{4}{x}[/math]. The derivatives are
The first derivative vanishes for[math]x = 2[/math] and [math]x = -2[/math], and thus we see that (2, 4) and [math](-2, -4)[/math] are critical points. The second derivative is negative when [math]x[/math] is negative, so the curve is bending down at [math](-2, -4)[/math] and that point must be a local maximum point. Similarly, [math]f''(2) \gt 0[/math] and (2, 4) is a local minimum point. [math]f(0)[/math] is unclefined and [math]|f(x)|[/math] increases as [math]x \rightarrow 0[/math]. Behavior for large values of [math]|x|[/math] can be seen, since [math]f(x)[/math] approaches [math]x[/math] as [math]x[/math] increases or decreases without bound.
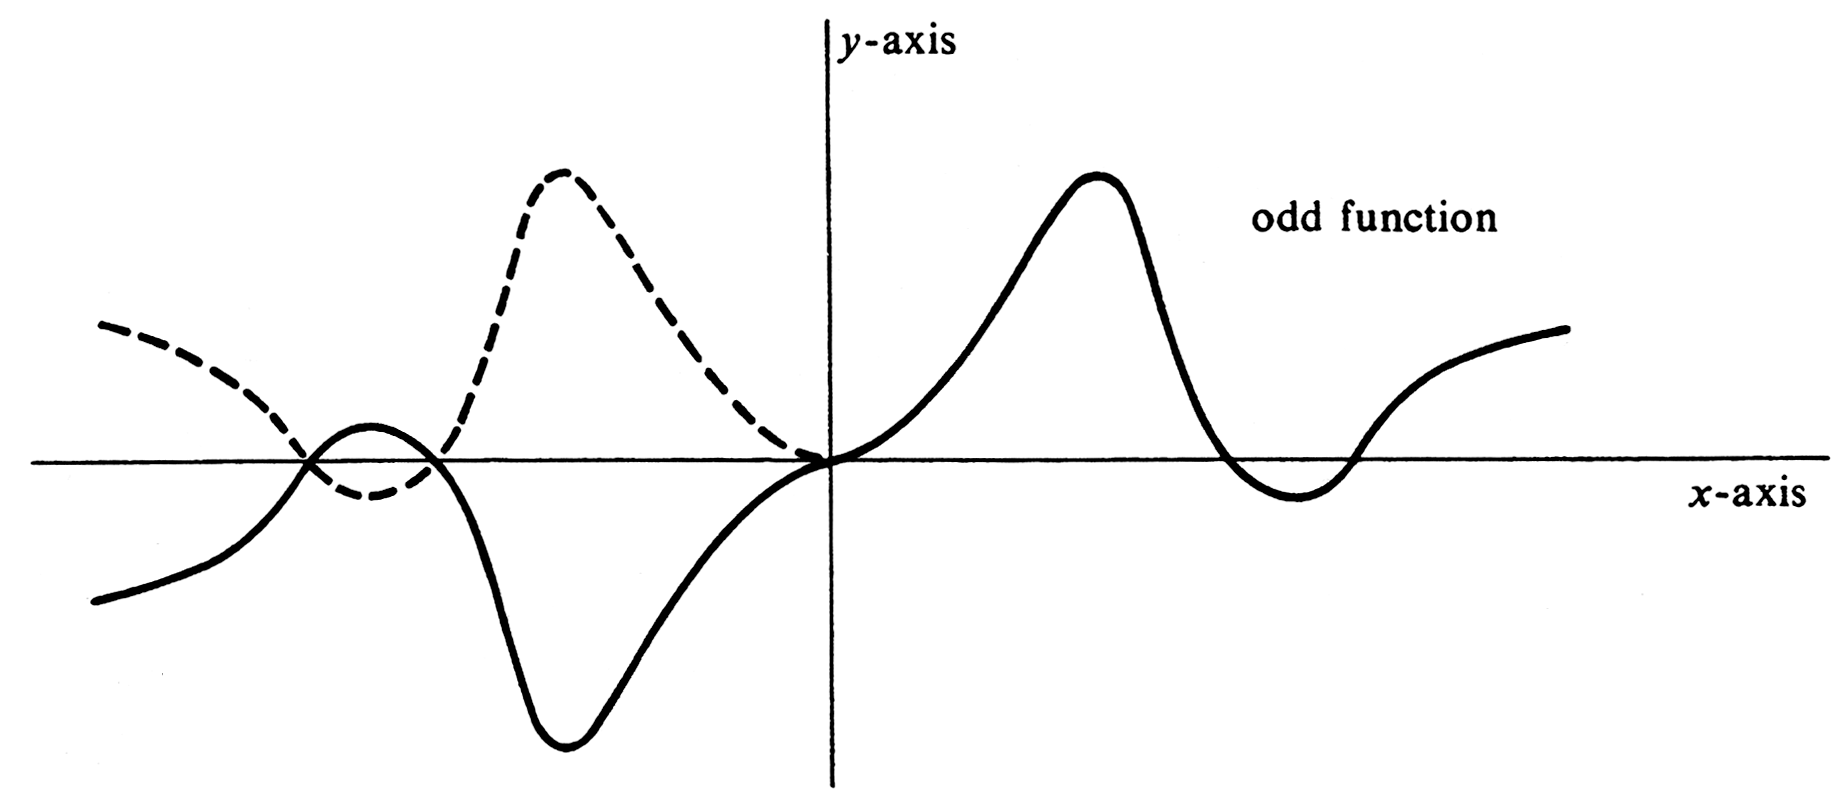
From Figure, one can see the graph approaching the vertical axis as [math]x \rightarrow 0[/math] from either side, and also approaching the graph of the equation [math]y = x[/math] as [math]|x|[/math] increases without bound. Note that the two parts of the graph are reflections of each other across the origin, and also that [math]f(-x) = -f(x)[/math]. Any function [math]f[/math] for which [math]f(-x) = -f(x)[/math] is called an odd function. The graph of an odd function may be obtained by first drawing the graph of [math]f(x)[/math], where [math]x \gt 0[/math] (see Figure). We may then obtain the remainder of the [math]y[/math]-axis graph by first reflecting this positive part about the [math]y[/math]-axis and then about the [math]x[/math]-axis. The result of reflecting first about one axis and then about the other we shall call reflection about the origin.
Summarizing the techniques of curve sketching, we find the first and second derivatives of the function with respect to [math]x[/math], we find the points where either derivative vanishes, and we determine critical points and points of inflection. Points of general use in graphing [math]f(x)[/math] include: \smallskip
- The tangent is horizontal if [math]f'(x) = 0[/math].
- The curve is concave downward if [math]f''(x)[/math] is negative, concave upward if [math]f''(x)[/math] is positive.
- [math](a,f(a))[/math] is a local maximum point if [math]f'(a) = 0[/math] and [math]f''(a) \lt 0[/math], a local minimum point if [math]f'(a) = 0[/math] and [math]f''(a) \gt 0[/math].
- [math](a,f(a))[/math] is a point of inflection if [math]f''(x)[/math] changes sign as [math]x[/math] increases through [math]a[/math].
- Even and odd functions need be investigated carefully only for [math]x \geq 0[/math]. The rest of the graph of an even function is found by reflection across the vertical axis, of an odd function by reflection about the origin.
General references
Doyle, Peter G. (2008). "Crowell and Slesnick's Calculus with Analytic Geometry" (PDF). Retrieved Oct 29, 2024.
