guide:968ea395f9: Difference between revisions
No edit summary |
mNo edit summary |
||
| (One intermediate revision by one other user not shown) | |||
| Line 1: | Line 1: | ||
<div class="d-none"><math> | |||
\newcommand{\ex}[1]{\item } | |||
\newcommand{\sx}{\item} | |||
\newcommand{\x}{\sx} | |||
\newcommand{\sxlab}[1]{} | |||
\newcommand{\xlab}{\sxlab} | |||
\newcommand{\prov}[1] {\quad #1} | |||
\newcommand{\provx}[1] {\quad \mbox{#1}} | |||
\newcommand{\intext}[1]{\quad \mbox{#1} \quad} | |||
\newcommand{\R}{\mathrm{\bf R}} | |||
\newcommand{\Q}{\mathrm{\bf Q}} | |||
\newcommand{\Z}{\mathrm{\bf Z}} | |||
\newcommand{\C}{\mathrm{\bf C}} | |||
\newcommand{\dt}{\textbf} | |||
\newcommand{\goesto}{\rightarrow} | |||
\newcommand{\ddxof}[1]{\frac{d #1}{d x}} | |||
\newcommand{\ddx}{\frac{d}{dx}} | |||
\newcommand{\ddt}{\frac{d}{dt}} | |||
\newcommand{\dydx}{\ddxof y} | |||
\newcommand{\nxder}[3]{\frac{d^{#1}{#2}}{d{#3}^{#1}}} | |||
\newcommand{\deriv}[2]{\frac{d^{#1}{#2}}{dx^{#1}}} | |||
\newcommand{\dist}{\mathrm{distance}} | |||
\newcommand{\arccot}{\mathrm{arccot\:}} | |||
\newcommand{\arccsc}{\mathrm{arccsc\:}} | |||
\newcommand{\arcsec}{\mathrm{arcsec\:}} | |||
\newcommand{\arctanh}{\mathrm{arctanh\:}} | |||
\newcommand{\arcsinh}{\mathrm{arcsinh\:}} | |||
\newcommand{\arccosh}{\mathrm{arccosh\:}} | |||
\newcommand{\sech}{\mathrm{sech\:}} | |||
\newcommand{\csch}{\mathrm{csch\:}} | |||
\newcommand{\conj}[1]{\overline{#1}} | |||
\newcommand{\mathds}{\mathbb} | |||
</math></div> | |||
A third conic section, quite fashionable these days as astronauts circle the earth in elliptical orbits, is the ellipse. In this section we shall derive its equation and study its properties. | |||
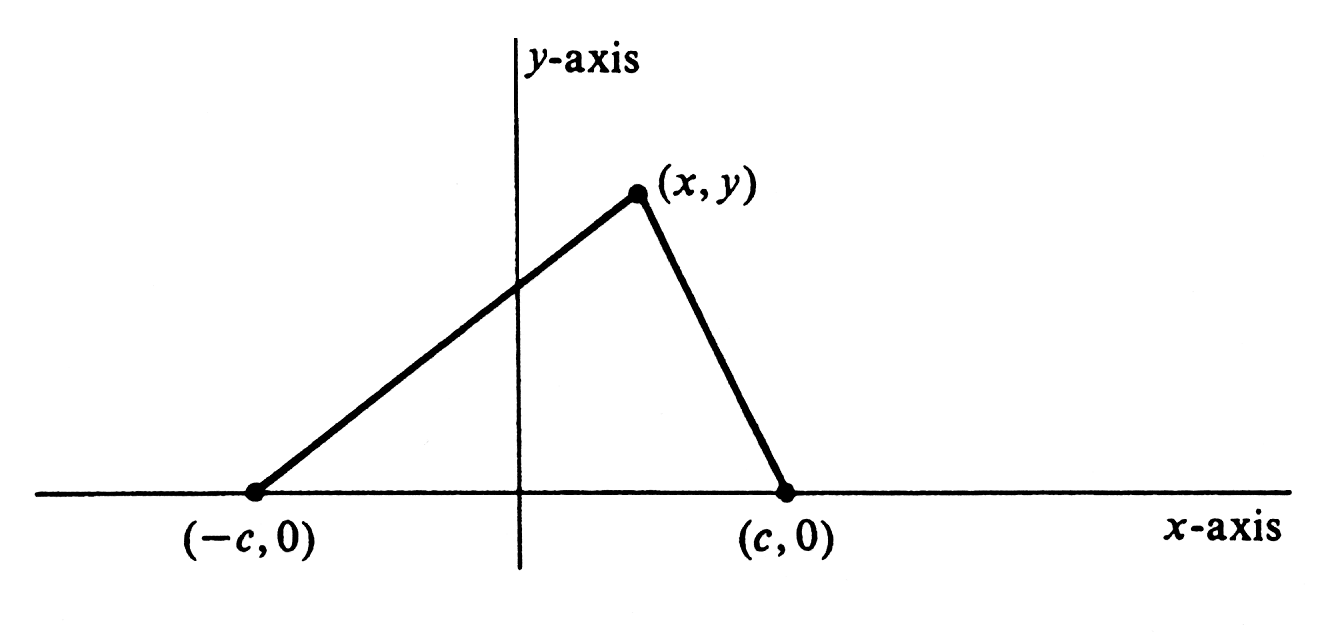
By definition, an '''ellipse''' is the locus of points in a plane the sum of whose distances from two given points is a constant. The constant, of course, must be greater than the distance between the two given points. The two points are called the foci of the ellipse. A simple equation for an ellipse is found if the points <math>(-c, 0)</math> and <math>(c, 0)</math> are used for foci and <math>2a</math> for the constant sum of distances. The foci and the arbitrary point <math>(x, y)</math> are shown in [[#fig 3.6|Figure]]. The distance from <math>(x, y)</math> to <math>(-c, 0)</math> is <math>\sqrt{(x + c)^2 + (y - 0)^2}</math>, and that from <math>(x, y)</math> to <math>(c, 0)</math> is <math>\sqrt{(x - c)^2 + (y - 0)^2}</math>. The point <math>(x, y)</math> lies on the ellipse if and only if the sum of these two distances is equal to <math>2a</math>. Hence an equation of the ellipse is | |||
<div id="fig 3.6" class="d-flex justify-content-center"> | |||
[[File:guide_c5467_scanfig3_6.png | 400px | thumb | ]] | |||
</div> | |||
<math display="block"> | |||
\sqrt{(x + c)^2 + y^2} + \sqrt{(x - c)^2 + y^2} = 2a. | |||
</math> | |||
Simpler equivalent equations are found by subtracting <math>\sqrt{(x - c)^2 + y^2}</math> from both sides of the equation | |||
<math display="block"> | |||
\sqrt{(x + c)^2 + y^2} = 2a - \sqrt{(x - c)^2 + y^2}, | |||
</math> | |||
squaring both sides of the equation and simplifying | |||
<math display="block"> | |||
\begin{array}{c} | |||
x^2 + 2cx + c^2 + y^2 = 4a^2 - 4a\sqrt{(x - c)^2 + y^2} + x^2 - 2cx + c^2 + y^2,\\ | |||
4a\sqrt{(x-c)^2 + y^2} = 4a^2 - 4cx, | |||
\end{array} | |||
</math> | |||
dividing by 4 and squaring again | |||
<math display="block"> | |||
a^2(x^2 - 2cx + c^2 + y^2) = a^4 - 2{a^2}cx + c^2{x^2}, | |||
</math> | |||
and simplifying again, | |||
<math display="block"> | |||
x^2(a^2 - c^2) + a^2y^2 = a^2(a^2 - c^2). | |||
</math> | |||
Finally, dividing by <math>a^2(a^2 - c^2)</math> we have | |||
<math display="block"> | |||
\frac{x^2}{a^2} + \frac{y^2}{a^2 - c^2} = 1. | |||
</math> | |||
Since <math>a > c</math>, it follows that <math>a^2 > c^2</math>, and we replace <math>a^2 - c^2</math> by <math>b^2</math>. We then have the canonical form of an equation for the ellipse, | |||
<math display="block"> | |||
\frac{x^2}{a^2} + \frac{y^2}{b^2} = 1. | |||
</math> | |||
This equation is derived in such a way that its graph contains all points which satisfy the locus condition. One of the problems at the end of the section will be to show that the graph contains only those points. | |||
<div id="fig 3.7" class="d-flex justify-content-center"> | |||
[[File:guide_c5467_scanfig3_7.png | 400px | thumb | ]] | |||
</div> | |||
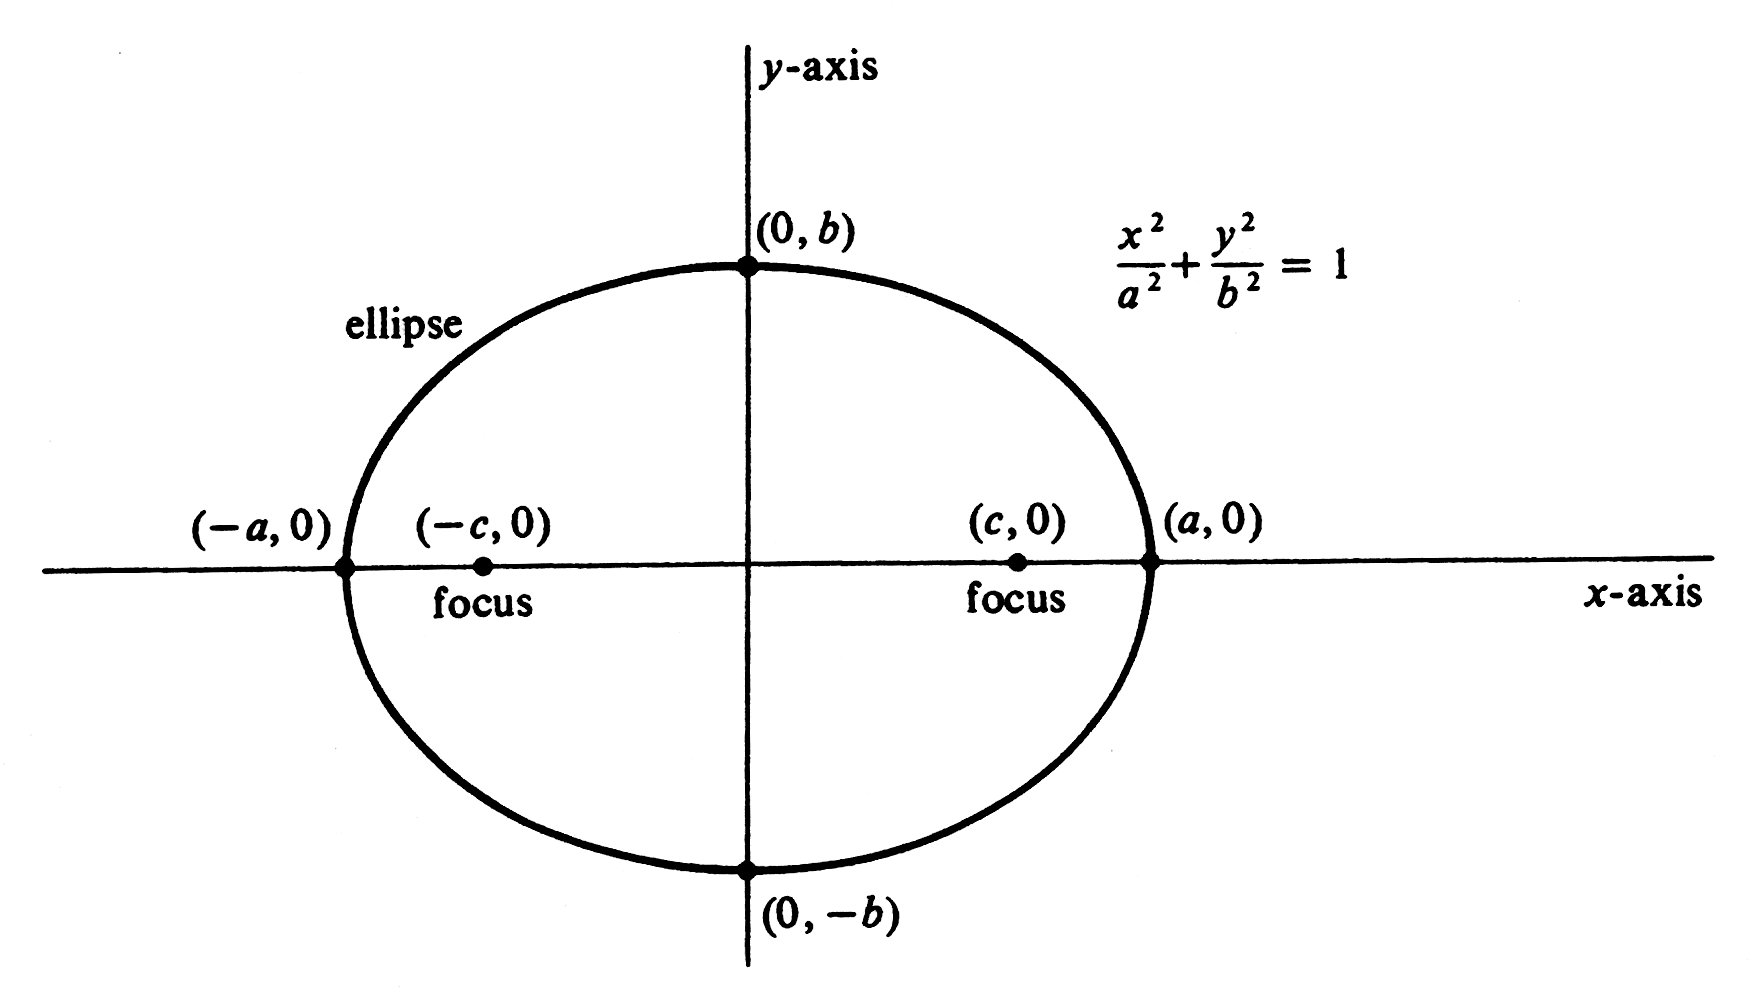
By placing <math>y</math> equal to 0, we obtain <math>x = \pm a</math>. The graph therefore cuts the <math>x</math>-axis at <math>(-a, 0)</math> and at <math>(a, 0)</math>, and the numbers <math>a</math> and <math>-a</math> are the <math>x</math> intercepts of the graph. The line segment between <math>(-a, 0)</math> and <math>(a, 0)</math> is called the '''major axis''' of the ellipse. Similarly, the graph cuts the <math>y</math>-axis at <math>(0,- b)</math> and at <math>(0, b)</math>, and the numbers <math>b</math> and <math>- b</math> are the <math>y</math>-intercepts of the graph. The line segment between <math>(0, -b)</math> and <math>(0, b)</math> is called the '''minor axis''' of the ellipse. It is not difficult to see that there are no points on the graph for which <math>|x| > a</math> or for <math>|y| > b</math>. Symmetry across both axes and across the origin can be seen by noting that <math>(-p, q)</math>, <math>(p, -q)</math>, and <math>(-p, -q)</math> all lie on the graph if <math>(p, q)</math> does. The complete curve is shown in [[#fig 3.7|Figure]]. | |||
There is a simple method of constructing an ellipse by placing thumbtacks at the foci and looping around them a string of length <math>2a + 2c</math>. If a pencil is placed in the loop so as to hold it taut and moved in a complete turn around the foci, the curve traced is an ellipse. This is readily seen from the definition. | |||
<span id="fig 3.8"/> | |||
'''Example''' | |||
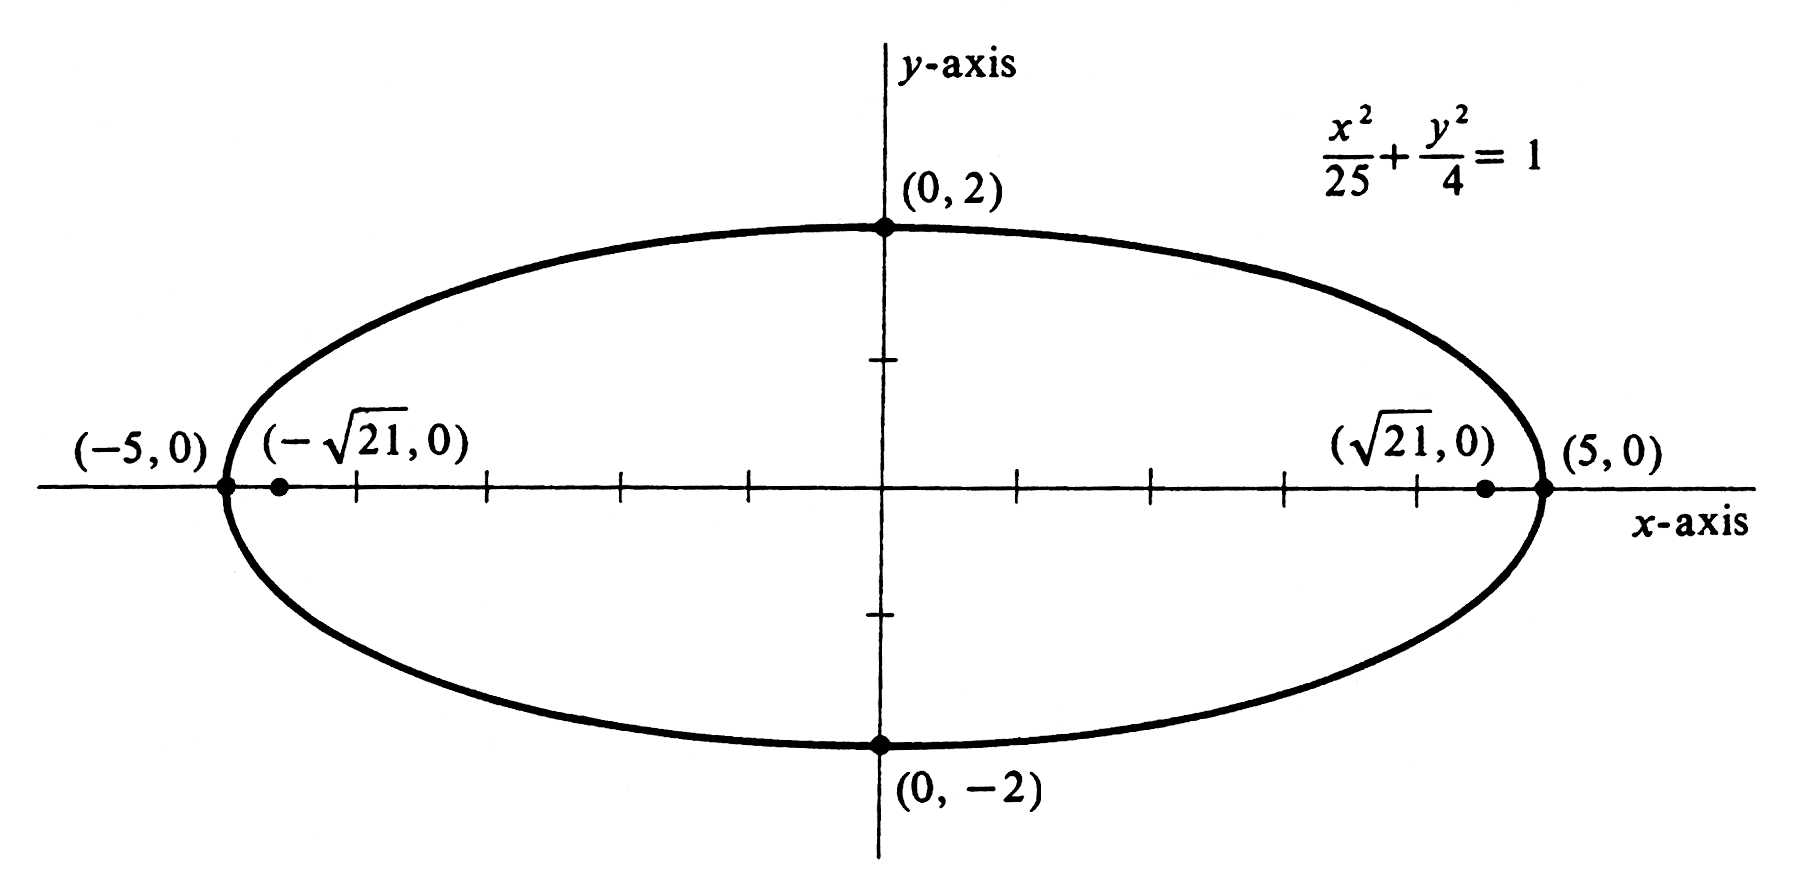
Describe the graph of <math>4x^2 + 25y^2 = 100</math> and draw it. An equivalent form of the equation is <math>\frac{x^2}{25} + \frac{y^2}{4} = 1</math>, from which it is apparent that the graph is an ellipse with <math>x</math>-intercepts of <math>-5</math> and 5, major axis of length 10, <math>y</math>-intercepts of <math>-2</math> and 2, and minor axis of length 4. The intersection of these axes, in this case the origin, is called the '''center''' of the ellipse. Using <math>a^2 = 25</math>, <math>a^2 - c^2 = 4</math>, we have <math>c^2 = 21</math>. Thus the foci are at <math>(-\sqrt {21}, 0)</math> and <math>(\sqrt{21}, 0)</math>. The graph is drawn in [[#fig 3.8|Figure]]. | |||
<div id="fig 3.8" class="d-flex justify-content-center"> | |||
[[File:guide_c5467_scanfig3_8.png | 400px | thumb | ]] | |||
</div> | |||
If the foci are located on the <math>y</math>-axis at <math>(0, c)</math> and <math>(0, - c)</math>, an analogous derivation gives the equation | |||
<math display="block"> | |||
\frac{x^2}{a^2 - c^2} + \frac{y^2}{a^2} = 1 | |||
</math> | |||
and its equivalent form | |||
<math display="block"> | |||
\frac{x^2}{b^2} + \frac{ y^2}{a^2} = 1. | |||
</math> | |||
In this case, the major axis is the line segment between <math>(0,-a)</math> and <math>(0, a)</math>, and the minor axis that between <math>(-b, 0)</math> and <math>(b, 0)</math>. | |||
'''Example''' | |||
Describe and draw the graph of <math>4x^2 + y^2 = 36</math>. An equivalent form of the equation is <math>\frac{x^2}{9} + \frac{y^2}{36} = 1</math>, from which we see that the positive <math>y</math>-intercept is larger than the positive <math>x</math>-intercept and therefore that the foci are on the <math>y</math>-axis. The <math>x</math>-intercepts are 3 and <math>-3</math>, the <math>y</math>-intercepts are 6 and <math>-6</math>, and the foci are at <math>(0, \sqrt{36 - 9})</math> and <math>(0, - 3 \sqrt3)</math>. The graph is drawn in [[#fig 3.9|Figure]]. | |||
<div id="fig 3.9" class="d-flex justify-content-center"> | |||
[[File:guide_c5467_scanfig3_9.png | 400px | thumb | ]] | |||
</div> | |||
Examples 1 and 2 were each for an ellipse with its center at the origin. In a manner similar to that used in the last section, we can write an equation for an ellipse with center at <math>(h, k)</math> and foci at <math>(h - c, k)</math> and <math>(h + c, k)</math>. The equation is then | |||
<math display="block"> | |||
\frac{(x-h)^2}{a^2} + \frac{(y-k)^2}{b^2} = 1. | |||
</math> | |||
If the center is at <math>(h, k)</math> and the foci at <math>(h, k - c)</math> and <math>(h, k + c)</math>, an equation is | |||
<math display="block"> | |||
\frac{(y-k)^2}{a^2} + \frac{(x - h)^2}{b^2} = 1 . | |||
</math> | |||
<span id="fig 3.10"/> | |||
'''Example''' | |||
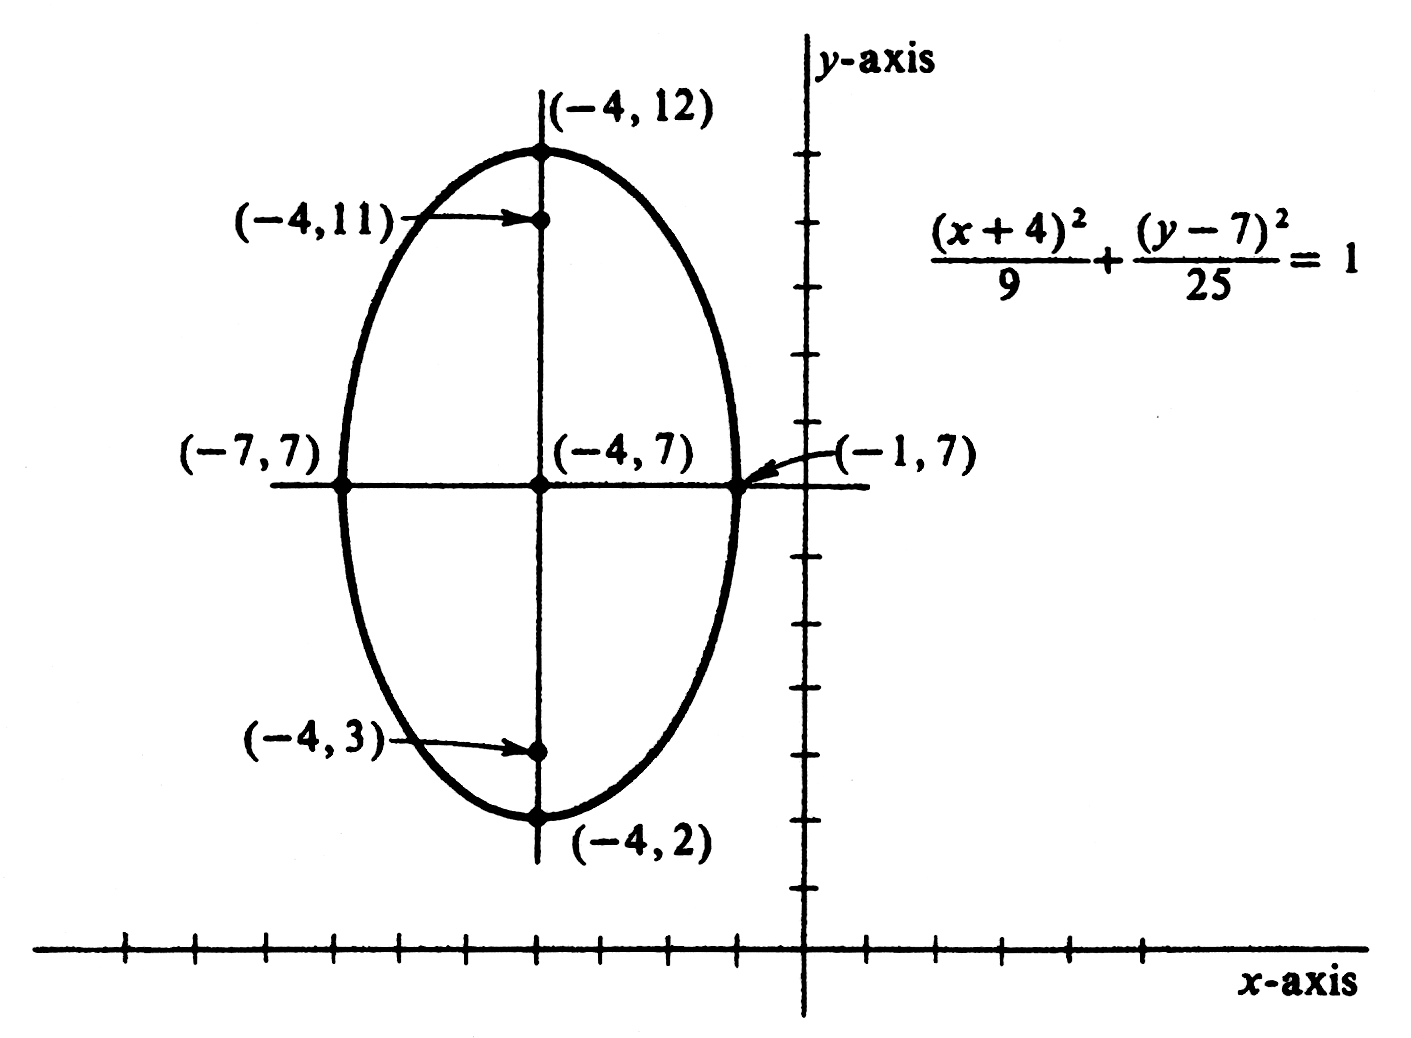
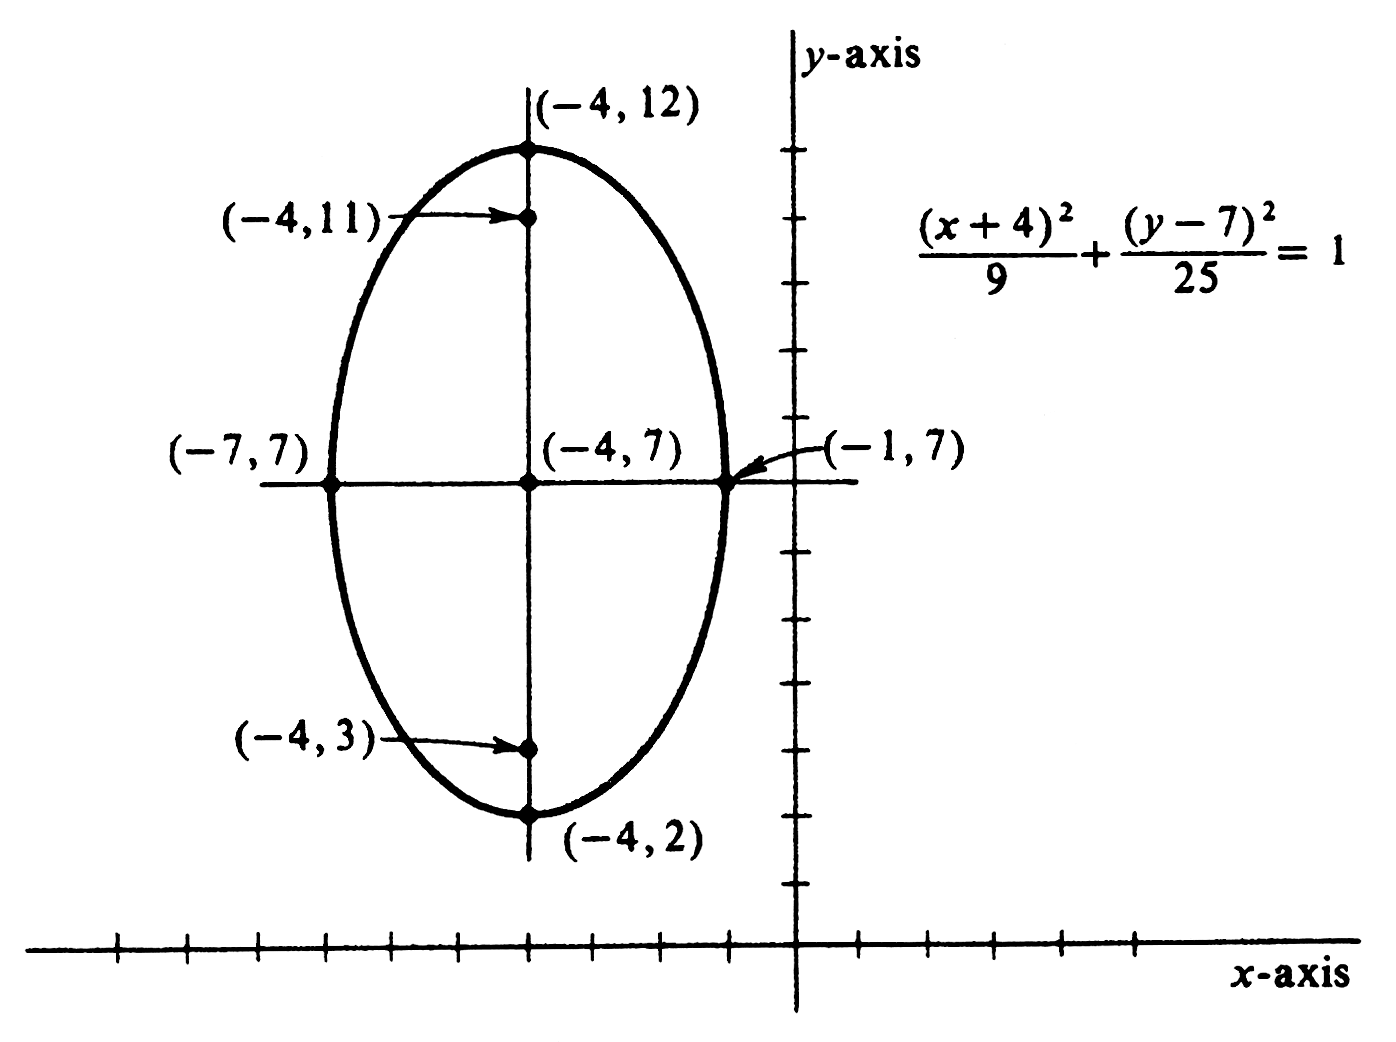
Describe and sketch the graph of <math>\frac{(x + 4)^2}{9} + \frac{(y - 7)^2}{25} = 1</math>. The graph is an ellipse with center at <math>(-4, 7)</math>. The foci are above and below | |||
the center;, the distance being <math>\sqrt{25 - 9} = 4</math>. Thus the foci are at <math>(-4, 3)</math> and <math>(-4, 11)</math>. The ends of the major axis are <math>(-4, 7 - 5)</math> or <math>(-4, 2)</math> and <math>(-4, 7 + 5)</math> or <math>(-4, 12)</math>. The ends of the minor axis are <math>(-4 - 3, 7)</math> or <math>(-7, 7)</math> and <math>(-4 + 3, 7)</math> or <math>(-1, 7)</math>. The graph is drawn in [[#fig 3.10|Figure]]. | |||
<div id="fig 3.10" class="d-flex justify-content-center"> | |||
[[File:guide_c5467_scanfig3_10.png | 400px | thumb | ]] | |||
</div> | |||
There is an alternative definition of the ellipse, one analogous to the definition of a parabola. It may be seen in considering the distance from a point <math>(x, y)</math> to the focus <math>(c, 0)</math>. This distance is <math>\sqrt{(x - c)^2 + y^2}</math>. If the point lies on the ellipse, then <math>\frac{x^2}{a^2} + \frac{y^2}{a^2 - c^2} = 1</math>, or <math>y^2 = a^2 - x^2 - c^2 + \frac{x^2 c^2}{a^2}</math>. Thus the distance from the point to the focus is | |||
<math display="block"> | |||
\sqrt{x^2 -2cx + c^2 + \Bigl(a^2 - x^2 - c^2 + \frac{x^2c^2}{a^2} \Bigr)}, | |||
</math> | |||
or | |||
<math display="block"> | |||
\sqrt{\frac{x^2 c^2 }{a^2} - 2cx + a^2}, | |||
</math> | |||
or | |||
<math display="block"> | |||
\Big| \frac{xc}{a} - a \Big|. | |||
</math> | |||
This latter expression may be written <math>\frac{c}{a} \Bigl|x - \frac{a^2}{c} \Bigr|</math>. But <math>\Bigl| x - \frac{a^2}{c} \Bigr|</math> is the distance from the point <math>(x, y)</math> to the line <math>x = \frac{a^2}{c}</math>. Thus the distance from the | |||
point to the focus <math>(c, 0)</math> is times the distance from the point to the line <math>x = \frac{a^2}{c}</math>. This result could also be stated by noting that the ratio of the two distances (that to the focus and that to the line) is a constant for all points on the ellipse. The line is called a '''directrix''' for the ellipse and the constant ratio, <math>\frac{c}{a}</math>, is called the '''eccentricity''' of the ellipse. The eccentricity is less than 1. For all points on a parabola, the ratio of the two distances (that to the focus and that to the directrix) is also a constant, namely 1. A parabola is said to have eccentricity 1. Even as the ellipse has two foci, it also has two directrices. The other is the line <math>x = -\frac{a^2}{c}</math>, and the ratio of the distance between a point on the ellipse and the focus <math>(-c, 0)</math> to the distance from the same point to the directrix <math>x = -\frac{a^2}{c}</math> is the same constantc <math>\frac{c}{a}</math>. | |||
Not all equations for ellipses are in canonical form, but equivalent equations in canonical form can be found by factoring and completing the square. | |||
'''Example''' | |||
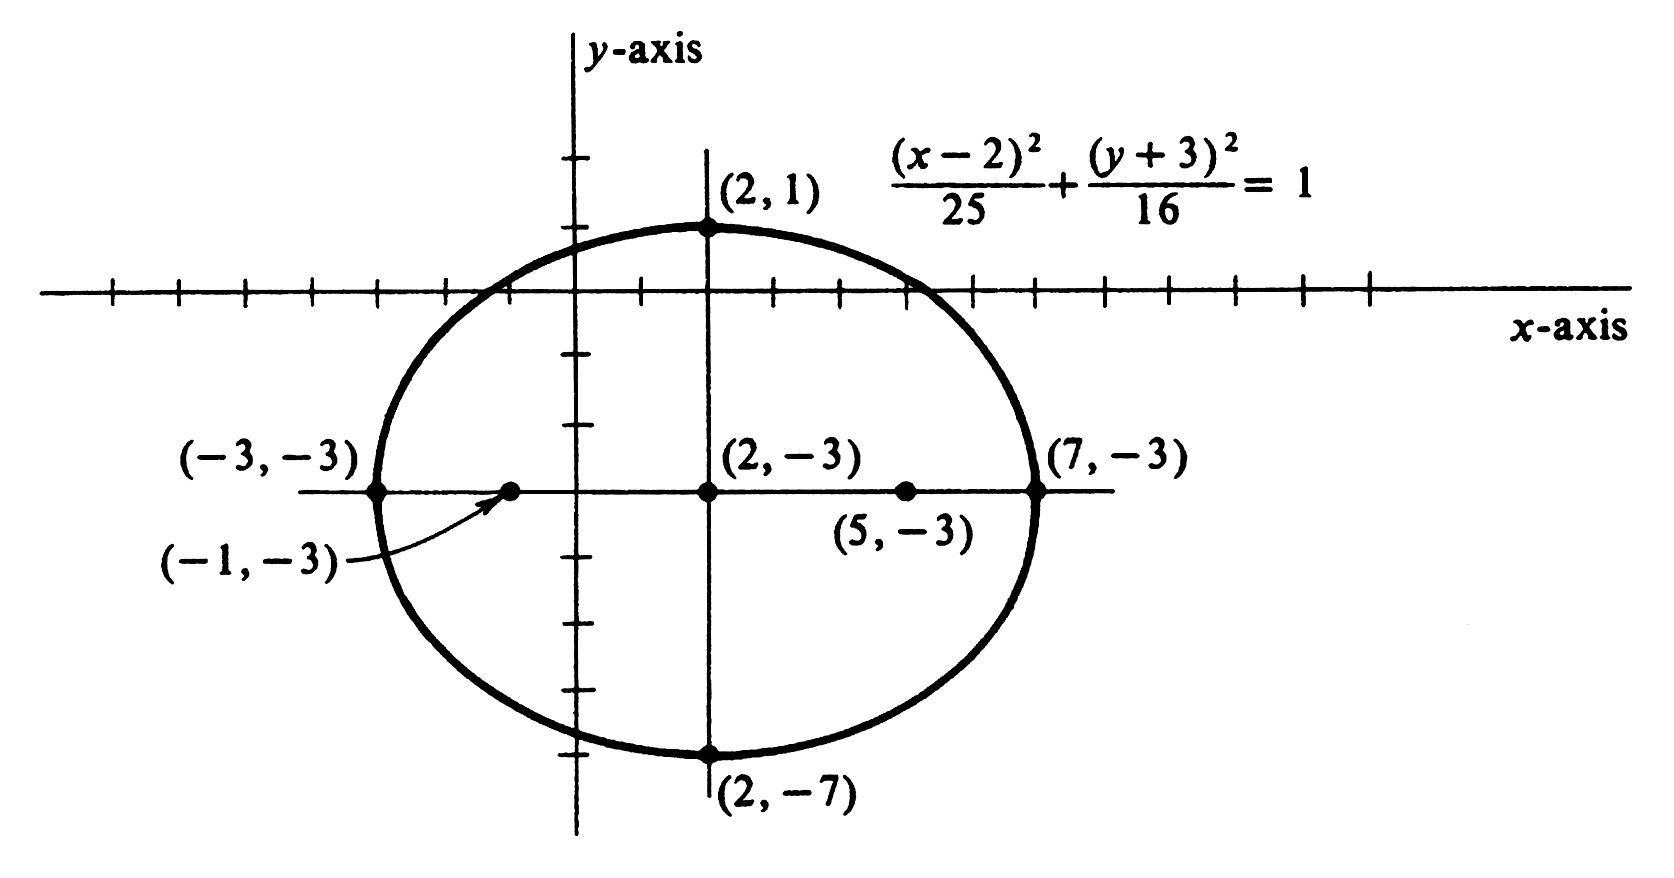
Describe and draw the graph of <math>16x^2 + 25y^2 - 64x + 150y - 111 = 0</math>. Equations equivalent to this one are | |||
<math display="block"> | |||
\begin{eqnarray*} | |||
16(x^2 - 4x) + 25(y^2 + 6y) &=& 111,\\ | |||
16(x^2 - 4x + 4) + 25(y^2 + 6y + 9) &=& 111 + 16 \cdot 4 + 25 \cdot 9, \\ | |||
16(x - 2)^2 + 25(y + 3)^2 &=& 400,\\ | |||
\frac{(x - 2)^2}{25} + \frac{(y + 3)^2}{16} &=& 1. | |||
\end{eqnarray*} | |||
</math> | |||
From the last equation we can see that the graph is an ellipse with center at <math>(2, -3)</math>, horizontal major axis of length 10, vertical minor axis of length 8, and <math>c = \sqrt{25 - 16}</math>. Thus the foci are at <math>(-1, -3)</math> and <math>(5, -3)</math>. The graph is shown in [[#fig 3.11|Figure]]. | |||
\medskip | |||
As Example 4 illustrates, almost every equation of the type <math>ax^2 + by^2 + cx + dy + e = 0</math> with <math>ab > 0</math> has an ellipse for its graph. The reason for the “almost” can be seen as we write equivalent equations | |||
<math display="block"> | |||
\begin{eqnarray*} | |||
a \Bigl(x^2 + \frac{c}{a} x \Bigr) + b \Bigl( y^2 + \frac{d}{b} y \Bigr) &=& - e,\\ | |||
a \Bigl(x^2 + \frac{c}{a} x + \frac{c^2}{4a^2} \Bigr) + b \Bigl( y^2 + \frac{d}{b} y + \frac{d^2}{4b^2} \Bigr) | |||
&=& \frac{c^2}{4a} + \frac{d^2}{4b} - e,\\ | |||
a \Bigl(x + \frac{c}{2a} \Bigr)^2 + b \Bigl( y + \frac{d}{2b} \Bigr)^2 &=& \frac{c^2}{4a} + \frac{d^2}{4b} - e. | |||
\end{eqnarray*} | |||
</math> | |||
If the expression on the right side of the last equation has the same sign as <math>a</math> (and hence <math>b</math>), then the graph is an ellipse. If the expression on the right side is equal to zero, the graph is the single point <math>\Bigl(-\frac{c}{2a}, -\frac{d}{2b} \Bigr)</math>. If the expression on the right side has sign opposite to that of <math>a</math>, there is no graph, although the equation is said to have an imaginary ellipse for its graph. If <math>a = b</math>, the foci coincide and the graph is a circle. | |||
<div id="fig 3.11" class="d-flex justify-content-center"> | |||
[[File:guide_c5467_scanfig3_11.png | 400px | thumb | ]] | |||
</div> | |||
==General references== | |||
{{cite web |title=Crowell and Slesnick’s Calculus with Analytic Geometry|url=https://math.dartmouth.edu/~doyle/docs/calc/calc.pdf |last=Doyle |first=Peter G.|date=2008 |access-date=Oct 29, 2024}} | |||
Latest revision as of 20:15, 5 November 2024
A third conic section, quite fashionable these days as astronauts circle the earth in elliptical orbits, is the ellipse. In this section we shall derive its equation and study its properties. By definition, an ellipse is the locus of points in a plane the sum of whose distances from two given points is a constant. The constant, of course, must be greater than the distance between the two given points. The two points are called the foci of the ellipse. A simple equation for an ellipse is found if the points [math](-c, 0)[/math] and [math](c, 0)[/math] are used for foci and [math]2a[/math] for the constant sum of distances. The foci and the arbitrary point [math](x, y)[/math] are shown in Figure. The distance from [math](x, y)[/math] to [math](-c, 0)[/math] is [math]\sqrt{(x + c)^2 + (y - 0)^2}[/math], and that from [math](x, y)[/math] to [math](c, 0)[/math] is [math]\sqrt{(x - c)^2 + (y - 0)^2}[/math]. The point [math](x, y)[/math] lies on the ellipse if and only if the sum of these two distances is equal to [math]2a[/math]. Hence an equation of the ellipse is
Simpler equivalent equations are found by subtracting [math]\sqrt{(x - c)^2 + y^2}[/math] from both sides of the equation
squaring both sides of the equation and simplifying
dividing by 4 and squaring again
and simplifying again,
Finally, dividing by [math]a^2(a^2 - c^2)[/math] we have
Since [math]a \gt c[/math], it follows that [math]a^2 \gt c^2[/math], and we replace [math]a^2 - c^2[/math] by [math]b^2[/math]. We then have the canonical form of an equation for the ellipse,
This equation is derived in such a way that its graph contains all points which satisfy the locus condition. One of the problems at the end of the section will be to show that the graph contains only those points.
By placing [math]y[/math] equal to 0, we obtain [math]x = \pm a[/math]. The graph therefore cuts the [math]x[/math]-axis at [math](-a, 0)[/math] and at [math](a, 0)[/math], and the numbers [math]a[/math] and [math]-a[/math] are the [math]x[/math] intercepts of the graph. The line segment between [math](-a, 0)[/math] and [math](a, 0)[/math] is called the major axis of the ellipse. Similarly, the graph cuts the [math]y[/math]-axis at [math](0,- b)[/math] and at [math](0, b)[/math], and the numbers [math]b[/math] and [math]- b[/math] are the [math]y[/math]-intercepts of the graph. The line segment between [math](0, -b)[/math] and [math](0, b)[/math] is called the minor axis of the ellipse. It is not difficult to see that there are no points on the graph for which [math]|x| \gt a[/math] or for [math]|y| \gt b[/math]. Symmetry across both axes and across the origin can be seen by noting that [math](-p, q)[/math], [math](p, -q)[/math], and [math](-p, -q)[/math] all lie on the graph if [math](p, q)[/math] does. The complete curve is shown in Figure. There is a simple method of constructing an ellipse by placing thumbtacks at the foci and looping around them a string of length [math]2a + 2c[/math]. If a pencil is placed in the loop so as to hold it taut and moved in a complete turn around the foci, the curve traced is an ellipse. This is readily seen from the definition.
Example
Describe the graph of [math]4x^2 + 25y^2 = 100[/math] and draw it. An equivalent form of the equation is [math]\frac{x^2}{25} + \frac{y^2}{4} = 1[/math], from which it is apparent that the graph is an ellipse with [math]x[/math]-intercepts of [math]-5[/math] and 5, major axis of length 10, [math]y[/math]-intercepts of [math]-2[/math] and 2, and minor axis of length 4. The intersection of these axes, in this case the origin, is called the center of the ellipse. Using [math]a^2 = 25[/math], [math]a^2 - c^2 = 4[/math], we have [math]c^2 = 21[/math]. Thus the foci are at [math](-\sqrt {21}, 0)[/math] and [math](\sqrt{21}, 0)[/math]. The graph is drawn in Figure.
If the foci are located on the [math]y[/math]-axis at [math](0, c)[/math] and [math](0, - c)[/math], an analogous derivation gives the equation
and its equivalent form
In this case, the major axis is the line segment between [math](0,-a)[/math] and [math](0, a)[/math], and the minor axis that between [math](-b, 0)[/math] and [math](b, 0)[/math].
Example
Describe and draw the graph of [math]4x^2 + y^2 = 36[/math]. An equivalent form of the equation is [math]\frac{x^2}{9} + \frac{y^2}{36} = 1[/math], from which we see that the positive [math]y[/math]-intercept is larger than the positive [math]x[/math]-intercept and therefore that the foci are on the [math]y[/math]-axis. The [math]x[/math]-intercepts are 3 and [math]-3[/math], the [math]y[/math]-intercepts are 6 and [math]-6[/math], and the foci are at [math](0, \sqrt{36 - 9})[/math] and [math](0, - 3 \sqrt3)[/math]. The graph is drawn in Figure.
Examples 1 and 2 were each for an ellipse with its center at the origin. In a manner similar to that used in the last section, we can write an equation for an ellipse with center at [math](h, k)[/math] and foci at [math](h - c, k)[/math] and [math](h + c, k)[/math]. The equation is then
If the center is at [math](h, k)[/math] and the foci at [math](h, k - c)[/math] and [math](h, k + c)[/math], an equation is
Example
Describe and sketch the graph of [math]\frac{(x + 4)^2}{9} + \frac{(y - 7)^2}{25} = 1[/math]. The graph is an ellipse with center at [math](-4, 7)[/math]. The foci are above and below the center;, the distance being [math]\sqrt{25 - 9} = 4[/math]. Thus the foci are at [math](-4, 3)[/math] and [math](-4, 11)[/math]. The ends of the major axis are [math](-4, 7 - 5)[/math] or [math](-4, 2)[/math] and [math](-4, 7 + 5)[/math] or [math](-4, 12)[/math]. The ends of the minor axis are [math](-4 - 3, 7)[/math] or [math](-7, 7)[/math] and [math](-4 + 3, 7)[/math] or [math](-1, 7)[/math]. The graph is drawn in Figure.
There is an alternative definition of the ellipse, one analogous to the definition of a parabola. It may be seen in considering the distance from a point [math](x, y)[/math] to the focus [math](c, 0)[/math]. This distance is [math]\sqrt{(x - c)^2 + y^2}[/math]. If the point lies on the ellipse, then [math]\frac{x^2}{a^2} + \frac{y^2}{a^2 - c^2} = 1[/math], or [math]y^2 = a^2 - x^2 - c^2 + \frac{x^2 c^2}{a^2}[/math]. Thus the distance from the point to the focus is
or
or
This latter expression may be written [math]\frac{c}{a} \Bigl|x - \frac{a^2}{c} \Bigr|[/math]. But [math]\Bigl| x - \frac{a^2}{c} \Bigr|[/math] is the distance from the point [math](x, y)[/math] to the line [math]x = \frac{a^2}{c}[/math]. Thus the distance from the point to the focus [math](c, 0)[/math] is times the distance from the point to the line [math]x = \frac{a^2}{c}[/math]. This result could also be stated by noting that the ratio of the two distances (that to the focus and that to the line) is a constant for all points on the ellipse. The line is called a directrix for the ellipse and the constant ratio, [math]\frac{c}{a}[/math], is called the eccentricity of the ellipse. The eccentricity is less than 1. For all points on a parabola, the ratio of the two distances (that to the focus and that to the directrix) is also a constant, namely 1. A parabola is said to have eccentricity 1. Even as the ellipse has two foci, it also has two directrices. The other is the line [math]x = -\frac{a^2}{c}[/math], and the ratio of the distance between a point on the ellipse and the focus [math](-c, 0)[/math] to the distance from the same point to the directrix [math]x = -\frac{a^2}{c}[/math] is the same constantc [math]\frac{c}{a}[/math]. Not all equations for ellipses are in canonical form, but equivalent equations in canonical form can be found by factoring and completing the square.
Example
Describe and draw the graph of [math]16x^2 + 25y^2 - 64x + 150y - 111 = 0[/math]. Equations equivalent to this one are
From the last equation we can see that the graph is an ellipse with center at [math](2, -3)[/math], horizontal major axis of length 10, vertical minor axis of length 8, and [math]c = \sqrt{25 - 16}[/math]. Thus the foci are at [math](-1, -3)[/math] and [math](5, -3)[/math]. The graph is shown in Figure. \medskip As Example 4 illustrates, almost every equation of the type [math]ax^2 + by^2 + cx + dy + e = 0[/math] with [math]ab \gt 0[/math] has an ellipse for its graph. The reason for the “almost” can be seen as we write equivalent equations
If the expression on the right side of the last equation has the same sign as [math]a[/math] (and hence [math]b[/math]), then the graph is an ellipse. If the expression on the right side is equal to zero, the graph is the single point [math]\Bigl(-\frac{c}{2a}, -\frac{d}{2b} \Bigr)[/math]. If the expression on the right side has sign opposite to that of [math]a[/math], there is no graph, although the equation is said to have an imaginary ellipse for its graph. If [math]a = b[/math], the foci coincide and the graph is a circle.
General references
Doyle, Peter G. (2008). "Crowell and Slesnick's Calculus with Analytic Geometry" (PDF). Retrieved Oct 29, 2024.
