guide:0922bf5a1a: Difference between revisions
No edit summary |
mNo edit summary |
||
| (One intermediate revision by the same user not shown) | |||
| Line 1: | Line 1: | ||
'''Cluster analysis''' or '''clustering''' is the task of grouping a set of objects in such a way that objects in the same group (called a '''cluster''') are more similar (in some sense) to each other than to those in other groups (clusters). | |||
Cluster analysis itself is not one specific [[algorithm|algorithm]], but the general task to be solved. It can be achieved by various algorithms that differ significantly in their understanding of what constitutes a cluster and how to efficiently find them. Popular notions of clusters include groups with small [[Distance function|distances]] between cluster members, dense areas of the data space, intervals or particular [[statistical distribution|statistical distribution]]s. Clustering can therefore be formulated as a [[multi-objective optimization|multi-objective optimization]] problem. The appropriate clustering algorithm and parameter settings (including parameters such as the [[Metric (mathematics)|distance function]] to use, a density threshold or the number of expected clusters) depend on the individual [[data set|data set]] and intended use of the results. Cluster analysis as such is not an automatic task, but an iterative process of [[knowledge discovery|knowledge discovery]] or interactive multi-objective optimization that involves trial and failure. It is often necessary to modify [[data preprocessing|data preprocessing]] and model parameters until the result achieves the desired properties. | |||
== Definition == | |||
The notion of a "cluster" cannot be precisely defined, which is one of the reasons why there are so many clustering algorithms.<ref name="estivill">{{cite journal | title=Why so many clustering algorithms – A Position Paper | last = Estivill-Castro | first = Vladimir | s2cid = 7329935 | journal=ACM SIGKDD Explorations Newsletter |date=20 June 2002 | volume= 4 | issue=1 | pages=65–75 | doi=10.1145/568574.568575}}</ref> There is a common denominator: a group of data objects. However, different researchers employ different cluster models, and for each of these cluster models again different algorithms can be given. The notion of a cluster, as found by different algorithms, varies significantly in its properties. Understanding these "cluster models" is key to understanding the differences between the various algorithms. Typical cluster models include: | |||
A "clustering" is essentially a set of such clusters, usually containing all objects in the data set. Additionally, it may specify the relationship of the clusters to each other, for example, a hierarchy of clusters embedded in each other. Clusterings can be roughly distinguished as: | |||
{| class="table" | |||
|- | |||
! Type !! Description | |||
|- | |||
| Hard clustering || Each object belongs to a cluster or not | |||
|- | |||
| Soft clustering || Each object belongs to each cluster to a certain degree (for example, a likelihood of belonging to the cluster) | |||
|} | |||
There are also finer distinctions possible, for example: | |||
{| class="table" | |||
|- | |||
! Type !! Description | |||
|- | |||
| Strict partitioning clustering || Each object belongs to exactly one cluster | |||
|- | |||
| Strict partitioning clustering with outliers || Objects can also belong to no cluster, and are considered [[Anomaly detection|outliers]] | |||
|- | |||
| Overlapping clustering (also: ''alternative clustering'', ''multi-view clustering'') || Objects may belong to more than one cluster; usually involving hard clusters | |||
|- | |||
| Hierarchical clustering || Objects that belong to a child cluster also belong to the parent cluster | |||
|- | |||
|[[Subspace clustering|Subspace clustering]] || While an overlapping clustering, within a uniquely defined subspace, clusters are not expected to overlap | |||
|} | |||
== Algorithms == | |||
As listed above, clustering algorithms can be categorized based on their cluster model. The following overview will only list the most prominent examples of clustering algorithms, as there are possibly over 100 published clustering algorithms. Not all provide models for their clusters and can thus not easily be categorized. | |||
There is no objectively "correct" clustering algorithm, but as it was noted, "clustering is in the eye of the beholder."<ref name="estivill" /> The most appropriate clustering algorithm for a particular problem often needs to be chosen experimentally, unless there is a mathematical reason to prefer one cluster model over another. An algorithm that is designed for one kind of model will generally fail on a data set that contains a radically different kind of model.<ref name="estivill" /> For example, k-means cannot find non-convex clusters.<ref name="estivill" /> | |||
=== Connectivity-based clustering (hierarchical clustering) === | |||
Connectivity-based clustering, also known as ''[[guide:2cfffcb6b0|hierarchical clustering]]'', is based on the core idea of objects being more related to nearby objects than to objects farther away. These algorithms connect "objects" to form "clusters" based on their distance. A cluster can be described largely by the maximum distance needed to connect parts of the cluster. At different distances, different clusters will form, which can be represented using a [[dendrogram|dendrogram]], which explains where the common name "[[guide:2cfffcb6b0|hierarchical clustering]]" comes from: these algorithms do not provide a single partitioning of the data set, but instead provide an extensive hierarchy of clusters that merge with each other at certain distances. In a dendrogram, the y-axis marks the distance at which the clusters merge, while the objects are placed along the x-axis such that the clusters don't mix. | |||
Connectivity-based clustering is a whole family of methods that differ by the way distances are computed. Apart from the usual choice of [[distance function|distance function]]s, the user also needs to decide on the linkage criterion (since a cluster consists of multiple objects, there are multiple candidates to compute the distance) to use. Popular choices are known as [[guide:2cfffcb6b0#Single-linkage Clustering|single-linkage clustering]] (the minimum of object distances), [[guide:2cfffcb6b0#Complete Linkage Clustering|complete linkage clustering]] (the maximum of object distances), and [[UPGMA|UPGMA]] or [[WPGMA|WPGMA]] ("Unweighted or Weighted Pair Group Method with Arithmetic Mean", also known as average linkage clustering). Furthermore, hierarchical clustering can be agglomerative (starting with single elements and aggregating them into clusters) or divisive (starting with the complete data set and dividing it into partitions). | |||
These methods will not produce a unique partitioning of the data set, but a hierarchy from which the user still needs to choose appropriate clusters. They are not very robust towards outliers, which will either show up as additional clusters or even cause other clusters to merge (known as "chaining phenomenon", in particular with [[guide:2cfffcb6b0#Single-linkage Clustering|single-linkage clustering]]). | |||
<gallery caption="Linkage clustering examples" widths="300px" heights="300px" class="text-center"> | |||
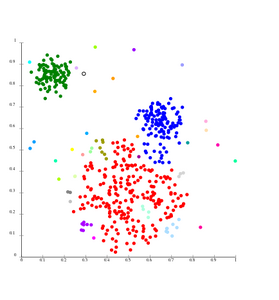
File:SLINK-Gaussian-data.svg|Single-linkage on Gaussian data. At 35 clusters, the biggest cluster starts fragmenting into smaller parts, while before it was still connected to the second largest due to the single-link effect. | |||
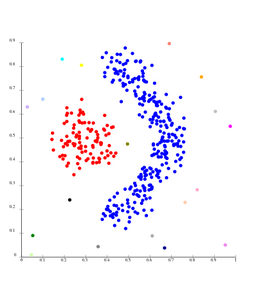
File:SLINK-density-data.svg|Single-linkage on density-based clusters. 20 clusters extracted, most of which contain single elements, since linkage clustering does not have a notion of "noise". | |||
</gallery> | |||
=== Centroid-based clustering === | |||
In centroid-based clustering, each cluster is represented by a central vector, which is not necessarily a member of the data set. When the number of clusters is fixed to ''k'', [[guide:A7f37b1612|''k''-means clustering]] gives a formal definition as an optimization problem: find the ''k'' cluster centers and assign the objects to the nearest cluster center, such that the squared distances from the cluster are minimized. | |||
The optimization problem itself is known to be [[NP-hard|NP-hard]], and thus the common approach is to search only for approximate solutions. A particularly well known approximate method is [[Lloyd's algorithm|Lloyd's algorithm]],<ref name="lloyd">{{Cite journal | last1 = Lloyd | first1 = S. | title = Least squares quantization in PCM | doi = 10.1109/TIT.1982.1056489 | journal = IEEE Transactions on Information Theory | volume = 28 | issue = 2 | pages = 129–137 | year = 1982 }}</ref> often just referred to as "''k-means algorithm''" (although [[guide:A7f37b1612#History|another algorithm introduced this name]]). It does however only find a [[local optimum|local optimum]], and is commonly run multiple times with different random initializations. Variations of ''k''-means often include such optimizations as choosing the best of multiple runs, but also restricting the centroids to members of the data set ([[wikipedia:K-medoids|''k''-medoids]]), choosing medians ([[wikipedia:k-medians clustering|''k''-medians clustering]]), choosing the initial centers less randomly ([[wikipedia:k-means++|''k''-means++]]) or allowing a fuzzy cluster assignment ([[wikipedia:Fuzzy clustering|fuzzy c-means]]). | |||
Most ''k''-means-type algorithms require the number of clusters – ''k'' – to be specified in advance, which is considered to be one of the biggest drawbacks of these algorithms. Furthermore, the algorithms prefer clusters of approximately similar size, as they will always assign an object to the nearest centroid. This often leads to incorrectly cut borders of clusters (which is not surprising since the algorithm optimizes cluster centers, not cluster borders). | |||
K-means has a number of interesting theoretical properties. First, it partitions the data space into a structure known as a [[Voronoi diagram|Voronoi diagram]]. Second, it is conceptually close to nearest neighbor classification, and as such is popular in machine learning. Third, it can be seen as a variation of model based clustering, and Lloyd's algorithm as a variation of the [[wikipedia:Expectation-maximization algorithm|Expectation-maximization algorithm]] for this model discussed below. | |||
<gallery caption="''k''-means clustering examples" widths="300" heights="300" class="text-center"> | |||
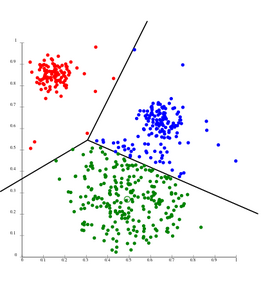
File:KMeans-Gaussian-data.svg|''k''-means separates data into Voronoi cells, which assumes equal-sized clusters (not adequate here) | |||
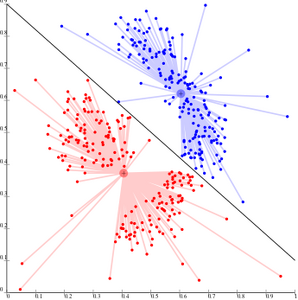
File:KMeans-density-data.svg|''k''-means cannot represent density-based clusters | |||
</gallery> | |||
Centroid-based clustering problems such as ''k''-means and ''k''-medoids are special cases of the uncapacitated, metric [[wikipedia:facility location problem|facility location problem]], a canonical problem in the operations research and computational geometry communities. In a basic facility location problem (of which there are numerous variants that model more elaborate settings), the task is to find the best warehouse locations to optimally service a given set of consumers. One may view "warehouses" as cluster centroids and "consumer locations" as the data to be clustered. This makes it possible to apply the well-developed algorithmic solutions from the facility location literature to the presently considered centroid-based clustering problem. | |||
==References== | |||
{{Reflist}} | |||
==Wikipedia References== | |||
*{{cite web |url = https://en.wikipedia.org/w/index.php?title=Cluster_analysis&oldid=1104837324|title=Cluster analysis | author = Wikipedia contributors |website= Wikipedia |publisher= Wikipedia |access-date = 17 August 2022 }} | |||
Latest revision as of 22:10, 14 April 2024
Cluster analysis or clustering is the task of grouping a set of objects in such a way that objects in the same group (called a cluster) are more similar (in some sense) to each other than to those in other groups (clusters).
Cluster analysis itself is not one specific algorithm, but the general task to be solved. It can be achieved by various algorithms that differ significantly in their understanding of what constitutes a cluster and how to efficiently find them. Popular notions of clusters include groups with small distances between cluster members, dense areas of the data space, intervals or particular statistical distributions. Clustering can therefore be formulated as a multi-objective optimization problem. The appropriate clustering algorithm and parameter settings (including parameters such as the distance function to use, a density threshold or the number of expected clusters) depend on the individual data set and intended use of the results. Cluster analysis as such is not an automatic task, but an iterative process of knowledge discovery or interactive multi-objective optimization that involves trial and failure. It is often necessary to modify data preprocessing and model parameters until the result achieves the desired properties.
Definition
The notion of a "cluster" cannot be precisely defined, which is one of the reasons why there are so many clustering algorithms.[1] There is a common denominator: a group of data objects. However, different researchers employ different cluster models, and for each of these cluster models again different algorithms can be given. The notion of a cluster, as found by different algorithms, varies significantly in its properties. Understanding these "cluster models" is key to understanding the differences between the various algorithms. Typical cluster models include:
A "clustering" is essentially a set of such clusters, usually containing all objects in the data set. Additionally, it may specify the relationship of the clusters to each other, for example, a hierarchy of clusters embedded in each other. Clusterings can be roughly distinguished as:
| Type | Description |
|---|---|
| Hard clustering | Each object belongs to a cluster or not |
| Soft clustering | Each object belongs to each cluster to a certain degree (for example, a likelihood of belonging to the cluster) |
There are also finer distinctions possible, for example:
| Type | Description |
|---|---|
| Strict partitioning clustering | Each object belongs to exactly one cluster |
| Strict partitioning clustering with outliers | Objects can also belong to no cluster, and are considered outliers |
| Overlapping clustering (also: alternative clustering, multi-view clustering) | Objects may belong to more than one cluster; usually involving hard clusters |
| Hierarchical clustering | Objects that belong to a child cluster also belong to the parent cluster |
| Subspace clustering | While an overlapping clustering, within a uniquely defined subspace, clusters are not expected to overlap |
Algorithms
As listed above, clustering algorithms can be categorized based on their cluster model. The following overview will only list the most prominent examples of clustering algorithms, as there are possibly over 100 published clustering algorithms. Not all provide models for their clusters and can thus not easily be categorized.
There is no objectively "correct" clustering algorithm, but as it was noted, "clustering is in the eye of the beholder."[1] The most appropriate clustering algorithm for a particular problem often needs to be chosen experimentally, unless there is a mathematical reason to prefer one cluster model over another. An algorithm that is designed for one kind of model will generally fail on a data set that contains a radically different kind of model.[1] For example, k-means cannot find non-convex clusters.[1]
Connectivity-based clustering (hierarchical clustering)
Connectivity-based clustering, also known as hierarchical clustering, is based on the core idea of objects being more related to nearby objects than to objects farther away. These algorithms connect "objects" to form "clusters" based on their distance. A cluster can be described largely by the maximum distance needed to connect parts of the cluster. At different distances, different clusters will form, which can be represented using a dendrogram, which explains where the common name "hierarchical clustering" comes from: these algorithms do not provide a single partitioning of the data set, but instead provide an extensive hierarchy of clusters that merge with each other at certain distances. In a dendrogram, the y-axis marks the distance at which the clusters merge, while the objects are placed along the x-axis such that the clusters don't mix.
Connectivity-based clustering is a whole family of methods that differ by the way distances are computed. Apart from the usual choice of distance functions, the user also needs to decide on the linkage criterion (since a cluster consists of multiple objects, there are multiple candidates to compute the distance) to use. Popular choices are known as single-linkage clustering (the minimum of object distances), complete linkage clustering (the maximum of object distances), and UPGMA or WPGMA ("Unweighted or Weighted Pair Group Method with Arithmetic Mean", also known as average linkage clustering). Furthermore, hierarchical clustering can be agglomerative (starting with single elements and aggregating them into clusters) or divisive (starting with the complete data set and dividing it into partitions).
These methods will not produce a unique partitioning of the data set, but a hierarchy from which the user still needs to choose appropriate clusters. They are not very robust towards outliers, which will either show up as additional clusters or even cause other clusters to merge (known as "chaining phenomenon", in particular with single-linkage clustering).
- Linkage clustering examples
-
Single-linkage on Gaussian data. At 35 clusters, the biggest cluster starts fragmenting into smaller parts, while before it was still connected to the second largest due to the single-link effect.
-
Single-linkage on density-based clusters. 20 clusters extracted, most of which contain single elements, since linkage clustering does not have a notion of "noise".
Centroid-based clustering
In centroid-based clustering, each cluster is represented by a central vector, which is not necessarily a member of the data set. When the number of clusters is fixed to k, k-means clustering gives a formal definition as an optimization problem: find the k cluster centers and assign the objects to the nearest cluster center, such that the squared distances from the cluster are minimized.
The optimization problem itself is known to be NP-hard, and thus the common approach is to search only for approximate solutions. A particularly well known approximate method is Lloyd's algorithm,[2] often just referred to as "k-means algorithm" (although another algorithm introduced this name). It does however only find a local optimum, and is commonly run multiple times with different random initializations. Variations of k-means often include such optimizations as choosing the best of multiple runs, but also restricting the centroids to members of the data set (k-medoids), choosing medians (k-medians clustering), choosing the initial centers less randomly (k-means++) or allowing a fuzzy cluster assignment (fuzzy c-means).
Most k-means-type algorithms require the number of clusters – k – to be specified in advance, which is considered to be one of the biggest drawbacks of these algorithms. Furthermore, the algorithms prefer clusters of approximately similar size, as they will always assign an object to the nearest centroid. This often leads to incorrectly cut borders of clusters (which is not surprising since the algorithm optimizes cluster centers, not cluster borders).
K-means has a number of interesting theoretical properties. First, it partitions the data space into a structure known as a Voronoi diagram. Second, it is conceptually close to nearest neighbor classification, and as such is popular in machine learning. Third, it can be seen as a variation of model based clustering, and Lloyd's algorithm as a variation of the Expectation-maximization algorithm for this model discussed below.
- k-means clustering examples
-
k-means separates data into Voronoi cells, which assumes equal-sized clusters (not adequate here)
-
k-means cannot represent density-based clusters
Centroid-based clustering problems such as k-means and k-medoids are special cases of the uncapacitated, metric facility location problem, a canonical problem in the operations research and computational geometry communities. In a basic facility location problem (of which there are numerous variants that model more elaborate settings), the task is to find the best warehouse locations to optimally service a given set of consumers. One may view "warehouses" as cluster centroids and "consumer locations" as the data to be clustered. This makes it possible to apply the well-developed algorithmic solutions from the facility location literature to the presently considered centroid-based clustering problem.
References
Wikipedia References
- Wikipedia contributors. "Cluster analysis". Wikipedia. Wikipedia. Retrieved 17 August 2022.


