exercise:Af2125b677: Difference between revisions
From Stochiki
(Created page with "The graph of the density function for losses is: File:examfams202317.png Calculate the loss elimination ratio for an ordinary deductible of 20. <ul class="mw-excansopts...") |
mNo edit summary |
||
| Line 1: | Line 1: | ||
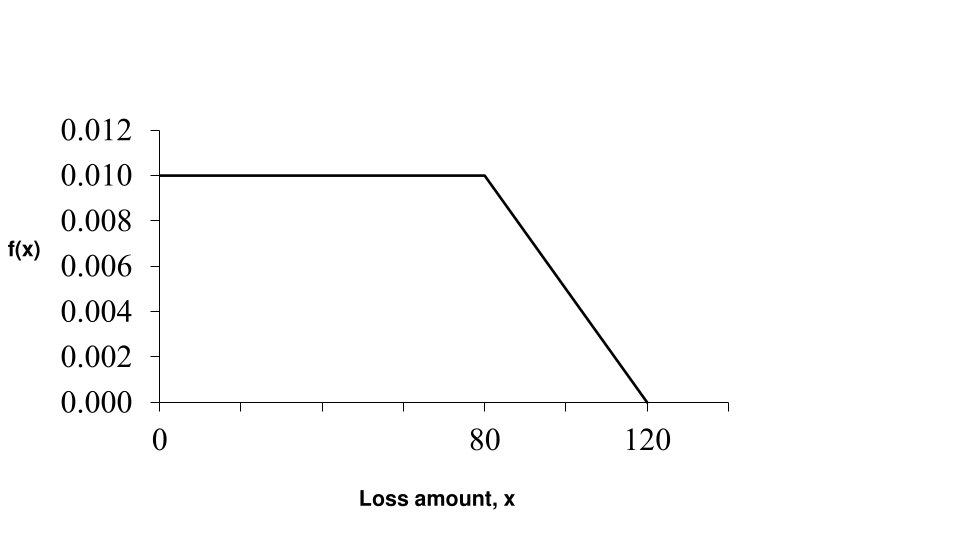
The graph of the density function for losses is: | The graph of the density function for losses is: | ||
[[File:examfams202317.png]] | <div class ="text-center"> | ||
[[File:examfams202317.png | 500px]] | |||
</div> | |||
Calculate the loss elimination ratio for an ordinary deductible of 20. | Calculate the loss elimination ratio for an ordinary deductible of 20. | ||
