guide:75bc735b57: Difference between revisions
No edit summary |
No edit summary |
||
| Line 1: | Line 1: | ||
<div class="d-none"><math> | |||
\newcommand{\ex}[1]{\item } | |||
\newcommand{\sx}{\item} | |||
\newcommand{\x}{\sx} | |||
\newcommand{\sxlab}[1]{} | |||
\newcommand{\xlab}{\sxlab} | |||
\newcommand{\prov}[1] {\quad #1} | |||
\newcommand{\provx}[1] {\quad \mbox{#1}} | |||
\newcommand{\intext}[1]{\quad \mbox{#1} \quad} | |||
\newcommand{\R}{\mathrm{\bf R}} | |||
\newcommand{\Q}{\mathrm{\bf Q}} | |||
\newcommand{\Z}{\mathrm{\bf Z}} | |||
\newcommand{\C}{\mathrm{\bf C}} | |||
\newcommand{\dt}{\textbf} | |||
\newcommand{\goesto}{\rightarrow} | |||
\newcommand{\ddxof}[1]{\frac{d #1}{d x}} | |||
\newcommand{\ddx}{\frac{d}{dx}} | |||
\newcommand{\ddt}{\frac{d}{dt}} | |||
\newcommand{\dydx}{\ddxof y} | |||
\newcommand{\nxder}[3]{\frac{d^{#1}{#2}}{d{#3}^{#1}}} | |||
\newcommand{\deriv}[2]{\frac{d^{#1}{#2}}{dx^{#1}}} | |||
\newcommand{\dist}{\mathrm{distance}} | |||
\newcommand{\arccot}{\mathrm{arccot\:}} | |||
\newcommand{\arccsc}{\mathrm{arccsc\:}} | |||
\newcommand{\arcsec}{\mathrm{arcsec\:}} | |||
\newcommand{\arctanh}{\mathrm{arctanh\:}} | |||
\newcommand{\arcsinh}{\mathrm{arcsinh\:}} | |||
\newcommand{\arccosh}{\mathrm{arccosh\:}} | |||
\newcommand{\sech}{\mathrm{sech\:}} | |||
\newcommand{\csch}{\mathrm{csch\:}} | |||
\newcommand{\conj}[1]{\overline{#1}} | |||
\newcommand{\mathds}{\mathbb} | |||
</math></div> | |||
===Polar Coordinates.=== | |||
Since the set <math>R^2</math> of all ordered pairs of real numbers has been identified with the set of all points in the plane, every point is uniquely determined by its <math>x</math>- and <math>y</math>-coordinates. An alternative way of specifying points in the plane is the following: To every ordered pair <math>(r, \theta)</math> of real numbers, we assign the point <math>P = (x, y)</math> in <math>R^2</math> defined by | |||
<span id{{=}}"eq10.6.1"/> | |||
<math display="block"> | |||
\begin{equation} | |||
\begin{array}{l} | |||
x = r\cos \theta, \\ | |||
y = r\sin \theta. | |||
\end{array} | |||
\label{eq10.6.1} | |||
\end{equation} | |||
</math> | |||
The pair <math>(r, \theta)</math> is called a pair of '''polar coordinates''' of the point <math>P = (x, y)</math>. | |||
In giving the geometric interpretation of polar coordinates of a point, we distinguish three separate possibilities: | |||
''Case 1.'' <math>r > 0</math>. Then <math>r</math> is the distance between <math>P = (x, y)</math> and the origin, since | |||
<math display="block"> | |||
\begin{eqnarray*} | |||
distance(P, (0, 0)) | |||
&=& \sqrt{x^2 + y^2} = \sqrt{r^2\cos^2 \theta + r^2 \sin^2 \theta} \\ | |||
&=& \sqrt{r^2(\cos^2 \theta + sin^2 \theta)} = \sqrt{r^2} \\ | |||
&=& r. | |||
\end{eqnarray*} | |||
</math> | |||
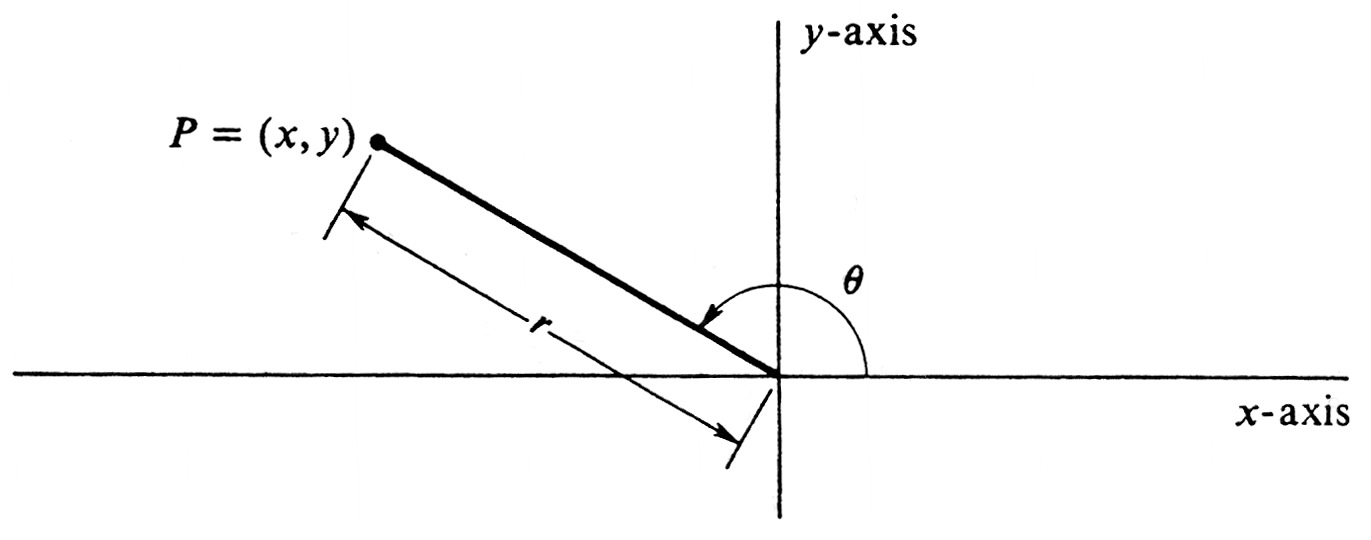
The number <math>\theta</math> is the radian measure of the angle which has its vertex at the origin, its initial side the positive <math>x</math>-axis, and its terminal side the line segment joining the origin to <math>P</math>. An example is shown in Figure 22. | |||
''Case 2.'' <math>r = 0</math>. Then <math>P</math> is the origin regardless of the value of <math>\theta</math>, since | |||
<math display="block"> | |||
P = (x, y) = (0 \cos \theta, 0 \sin \theta) = (0, 0). | |||
</math> | |||
\setcounter{figure}{21} | |||
<div id="fig 10.22" class="d-flex justify-content-center"> | |||
[[File:guide_c5467_scanfig10_22.png | 400px | thumb | ]] | |||
</div> | |||
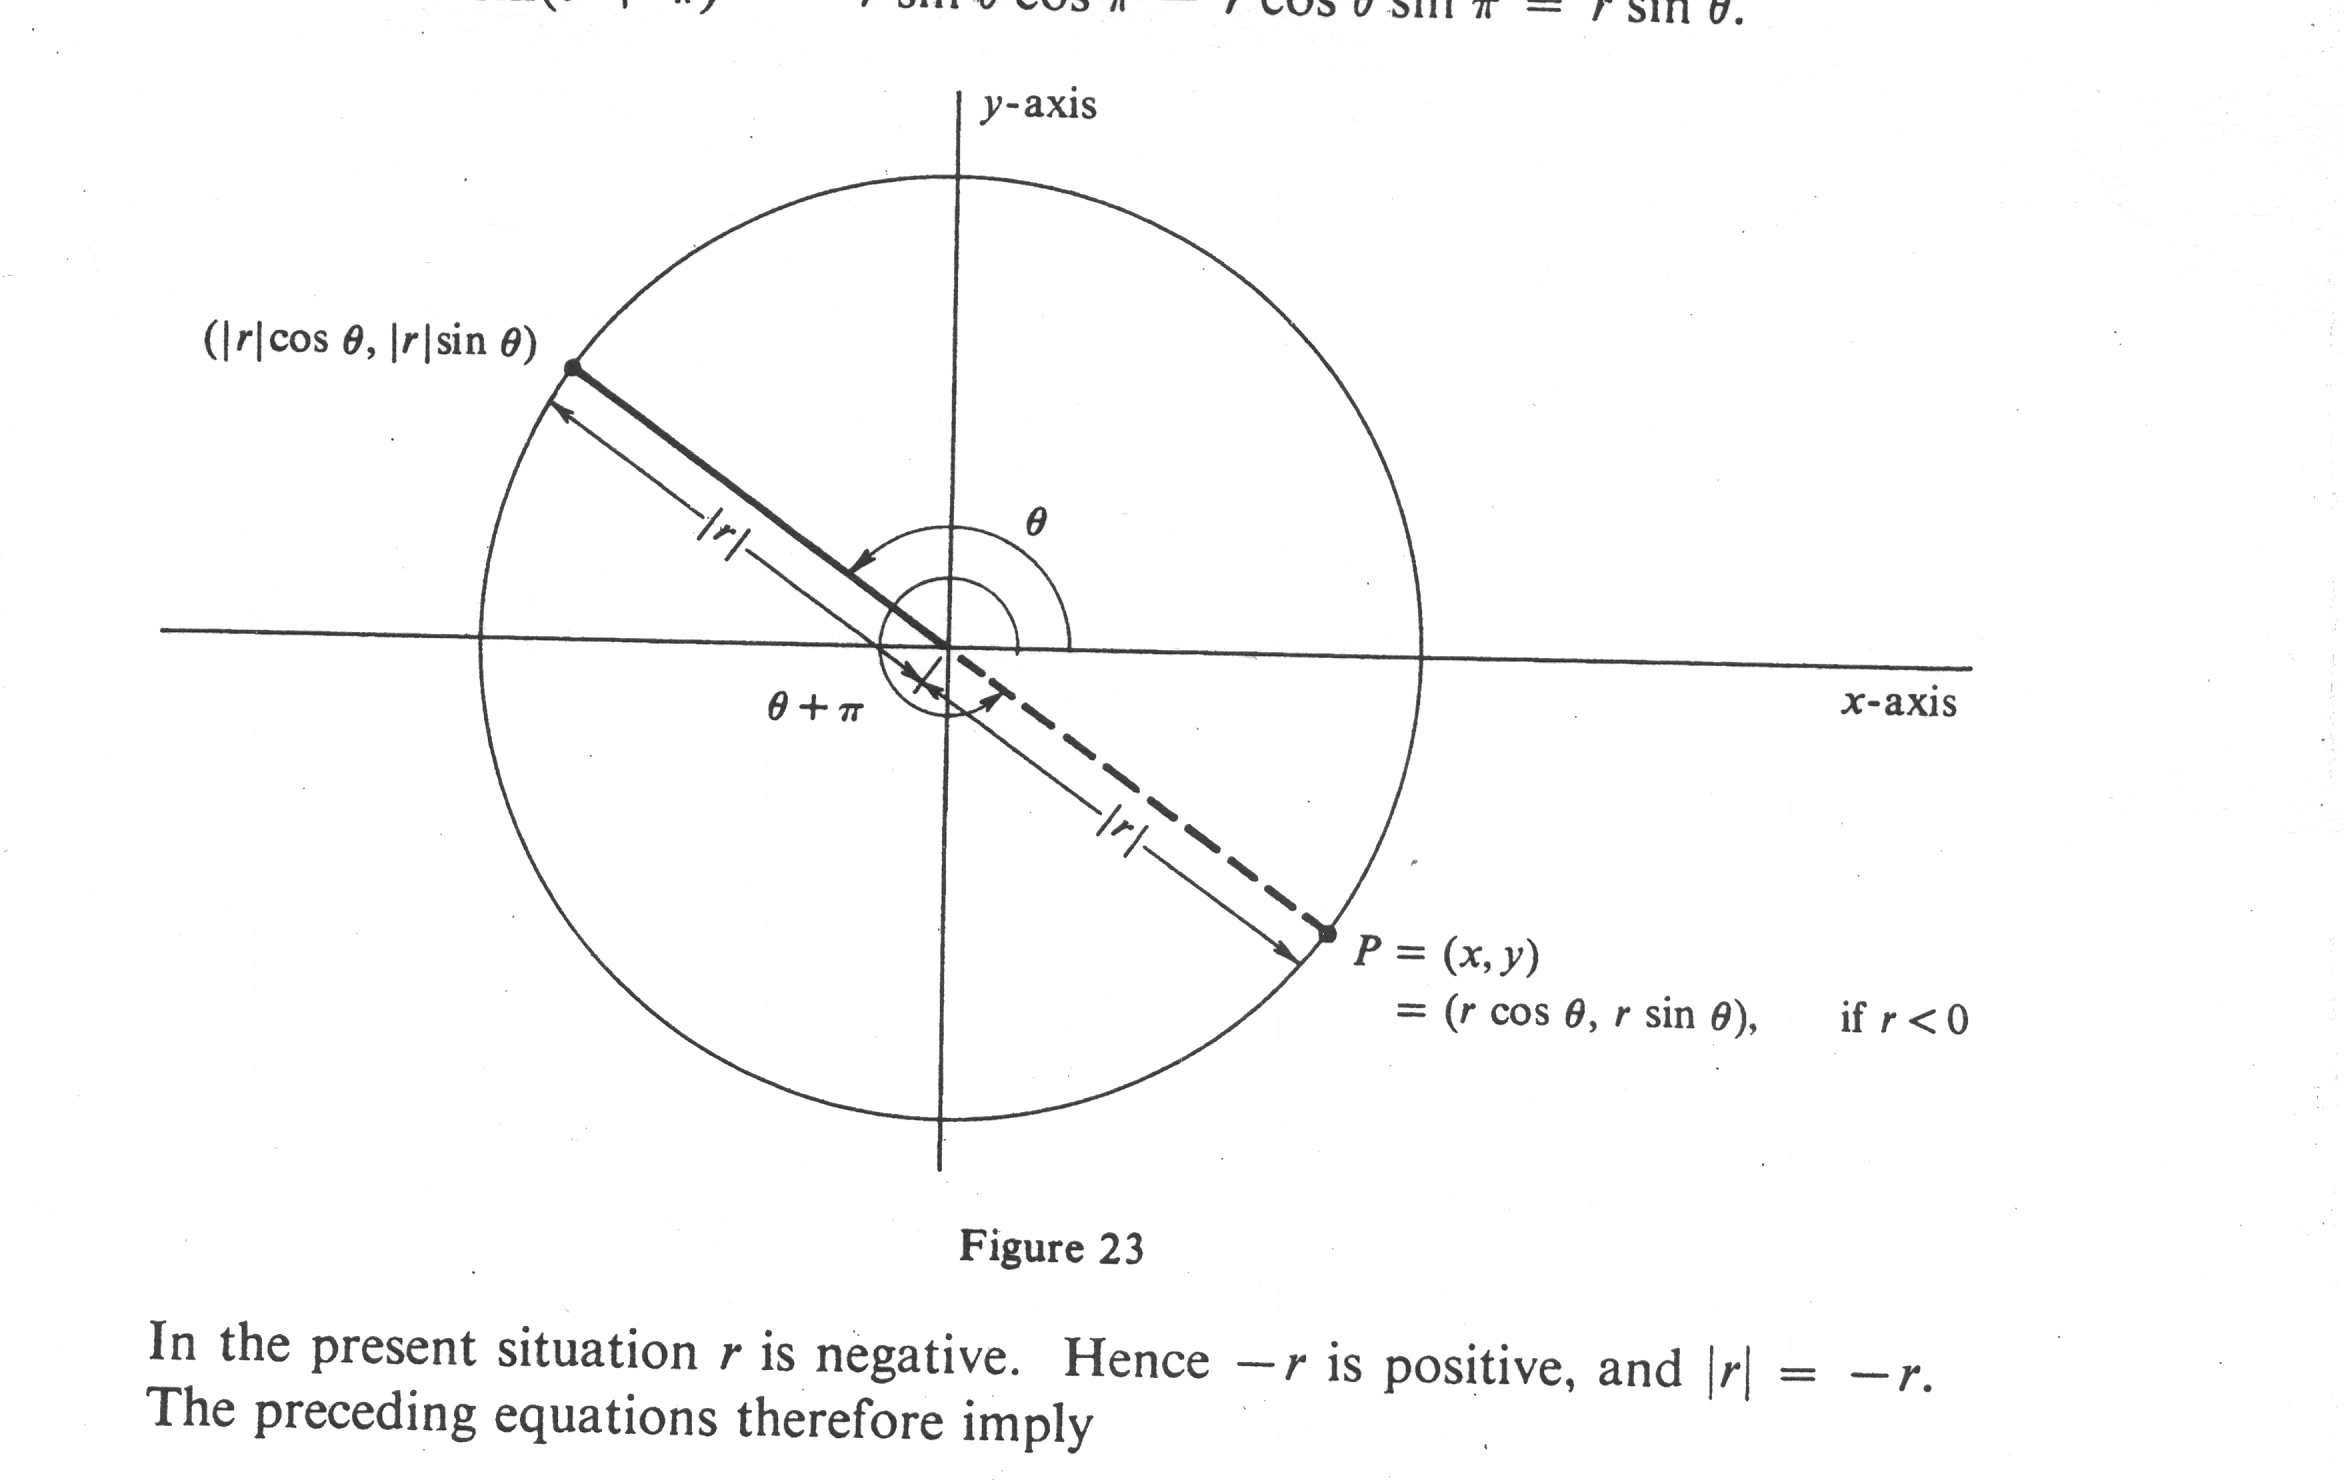
''Case 3.'' <math>r < 0</math>. In this case the point <math>P = (x, y)</math> is symmetric with respect to the origin to the point with polar coordinates <math>(|r|, \theta)</math>. This fact is illustrated in Figure 23. To prove it, we first observe that | |||
<math display="block"> | |||
\begin{eqnarray*} | |||
-r \cos(\theta + \pi) &=& -r \cos \theta \cos \pi + r \sin \theta \sin \pi = r \cos \theta, \\ | |||
-r \sin(\theta + \pi) &=& -r \sin \theta \cos \pi - r\cos \theta \sin \pi = r \sin \theta. | |||
\end{eqnarray*} | |||
</math> | |||
<div id="fig 10.23" class="d-flex justify-content-center"> | |||
[[File:guide_c5467_scanfig10_23.png | 400px | thumb | ]] | |||
</div> | |||
In the present situation r is negative. Hence <math>-r</math> is positive, and <math>|r| = -r</math>. The preceding equations therefore imply | |||
<math display="block"> | |||
\begin{eqnarray*} | |||
r \cos \theta &=& |r| \cos(\theta + \pi), \\ | |||
r \sin \theta &=& |r| \sin(\theta + \pi). | |||
\end{eqnarray*} | |||
</math> | |||
Thus | |||
<math display="block"> | |||
\begin{eqnarray*} | |||
P = (x, y) &=& (r \cos \theta, r \sin \theta) \\ | |||
&=& (|r| \cos(\theta + \pi), |r| \sin(\theta + \pi)), \;\;\;\mbox{if}\; r < 0, | |||
\end{eqnarray*} | |||
</math> | |||
and this is precisely what is asserted above. | |||
The major difference between polar coordinates and the familiar <math>x</math>- and <math>y</math>-coordinates is that if a given point <math>P = (x, y)</math> has one pair of polar coordinates <math>(r, \theta)</math>, then it has ''infinitely many:'' If <math>n</math> is any integer, then | |||
<math display="block"> | |||
\begin{eqnarray*} | |||
r \cos \theta &=& r \cos(\theta + 2\pi n), \\ | |||
r \sin \theta &=& r \sin (\theta + 2\pi n), | |||
\end{eqnarray*} | |||
</math> | |||
and it therefore follows that, for every integer <math>n</math>, the ordered pair <math>(r, \theta + 2\pi n)</math> is a pair of polar coordinates for the one point <math>P = (x, y) = (r \cos \theta, r \sin \theta)</math>. In addition, as shown in Case 3, we have | |||
<math display="block"> | |||
\begin{eqnarray*} | |||
-r \cos(\theta + \pi) &=& r \cos \theta, \\ | |||
-r \sin(\theta + \pi) &=& r \sin \theta. | |||
\end{eqnarray*} | |||
</math> | |||
Hence <math>(-r, \theta + \pi)</math> is also a pair of polar coordinates of <math>P</math>. We conclude that there is no such thing as the polar coordinates of a point. | |||
<div id="fig 10.24" class="d-flex justify-content-center"> | |||
[[File:guide_c5467_scanfig10_24.png | 400px | thumb | ]] | |||
</div> | |||
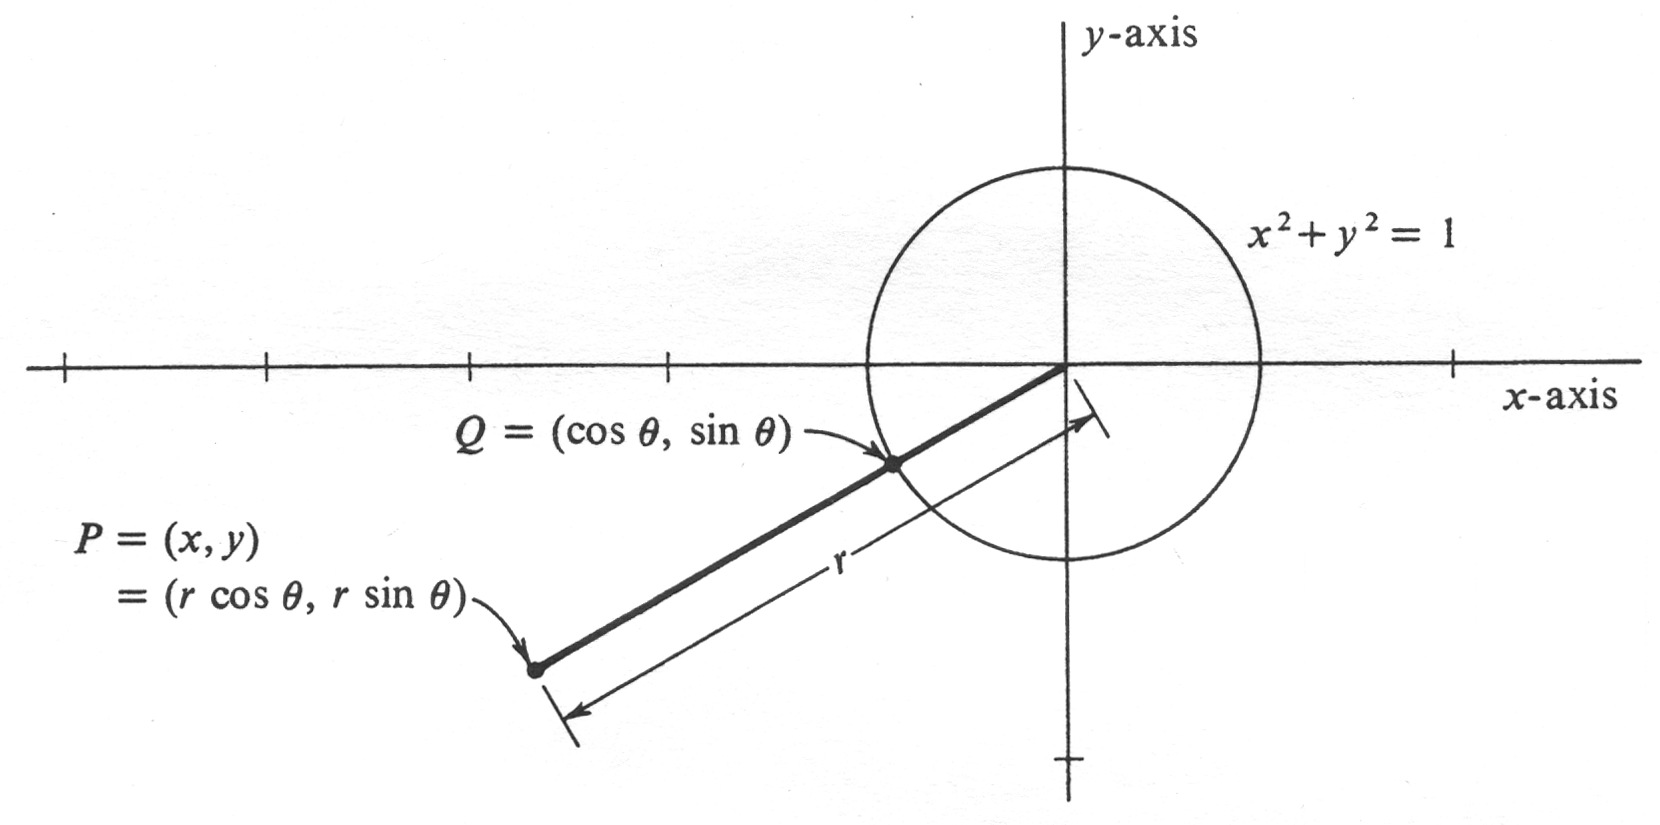
Of course, it is also important to realize that every point <math>P = (x, y)</math> has ''at least one'' pair of polar coordinates (and thence infinitely many). This is not hard to show. We set <math>r = \sqrt{x^2 + y^2}</math>. If <math>r = 0</math>, then <math>x = y = 0</math> and <math>P</math> is the origin. In this case, <math>(r, \theta) = (0, \theta)</math> is a pair of polar coordinates of <math>P</math> for any choice of <math>\theta</math>. If <math>r > 0</math>, then <math>P</math> is not the origin, and we let <math>Q</math> be the point on the unit circle (defined by <math>x^2 + y^2 = 1</math>) which lies on the half-line emanating from the origin and passing through <math>P</math> (see Figure 24). From our definition of the functions sine and cosine, we know that <math>Q = (\cos \theta, \sin \theta)</math> for some number <math>\theta</math>. It follows that | |||
<math display="block"> | |||
P = (r \cos \theta, r \sin \theta), | |||
</math> | |||
and so <math>(r, \theta)</math> is a pair of polar coordinates of <math>P</math>. | |||
<span id="fig 10.25"/> | |||
'''Example''' | |||
Determine the <math>x</math>- and <math>y</math>-coordinates of the points with the following polar coordinates, and plot the points in the plane. | |||
<math display="block"> | |||
\begin{eqnarray*} | |||
P_1: (r, \theta) &=& \Big( 2, \frac{\pi}{6} \Big),\\ | |||
P_2: (r, \theta) &=& \Big( -2, \frac{\pi}{6} \Big),\\ | |||
P_3: (r, \theta) &=& \Big( 2, -\frac{\pi}{6} \Big),\\ | |||
P_4: (r, \theta) &=& \Big( 2, \frac{7\pi}{6} \Big),\\ | |||
P_5: (r, \theta) &=& \Big( 3, \frac{10\pi}{6} \Big),\\ | |||
P_6: (r, \theta) &=& ( 0, \pi ). | |||
\end{eqnarray*} | |||
</math> | |||
If <math>(r, \theta)</math> is a pair of polar coordinates of a point <math>P</math>, then the <math>x</math>- and <math>y</math>-coordinates of <math>P</math> are given by | |||
<math display="block"> | |||
(x, y) = (r \cos \theta, r \sin \theta). | |||
</math> | |||
Hence, for each of the above, we get | |||
<math display="block"> | |||
\begin{eqnarray*} | |||
P_1 = (x, y) &=& \Big(2 \cos \frac{\pi}{6}, 2 \sin \frac{\pi}{6} \Big) = (\sqrt 3, 1), \\ | |||
P_2 = (x, y) &=& \Big(-2 \cos \frac{\pi}{6}, -2\sin \frac{\pi}{6} \Big)= ( -\sqrt 3, - 1), \\ | |||
P_3 = (x, y) &=& \Big(2 \cos (-\frac{\pi}{6}), 2 \sin (-\frac{\pi}{6}) \Big) \\ | |||
&=& \Big(2 \cos \frac{\pi}{6}, -2 \sin \frac{\pi}{6} \Big) = (\sqrt 3, -1), \\ | |||
P_4 = (x, y) &=& \Big(2 \cos \frac{7\pi}{6}, 2 \sin \frac{7\pi}{6} \Big) \\ | |||
&=& \Big(-2 \cos \frac{\pi}{6} -2\sin \frac{\pi}{6} \Big)= (-\sqrt 3, -1), \\ | |||
P_5 = (x, y) &=& \Big(3 \cos \frac{10\pi}{3}, 3 \sin \frac{10\pi}{3} \Big)\\ | |||
&=& \Big(3 \cos \frac{4\pi}{3}, 3 \sin\frac{4\pi}{3} \Big) = \Big(-\frac{3}{2}, -\frac{3\sqrt3}{2} \Big) \\ | |||
P_6 = (x, y) &=& (0 \cos \pi, 0 \sin \pi) = (0, 0). | |||
\end{eqnarray*} | |||
</math> | |||
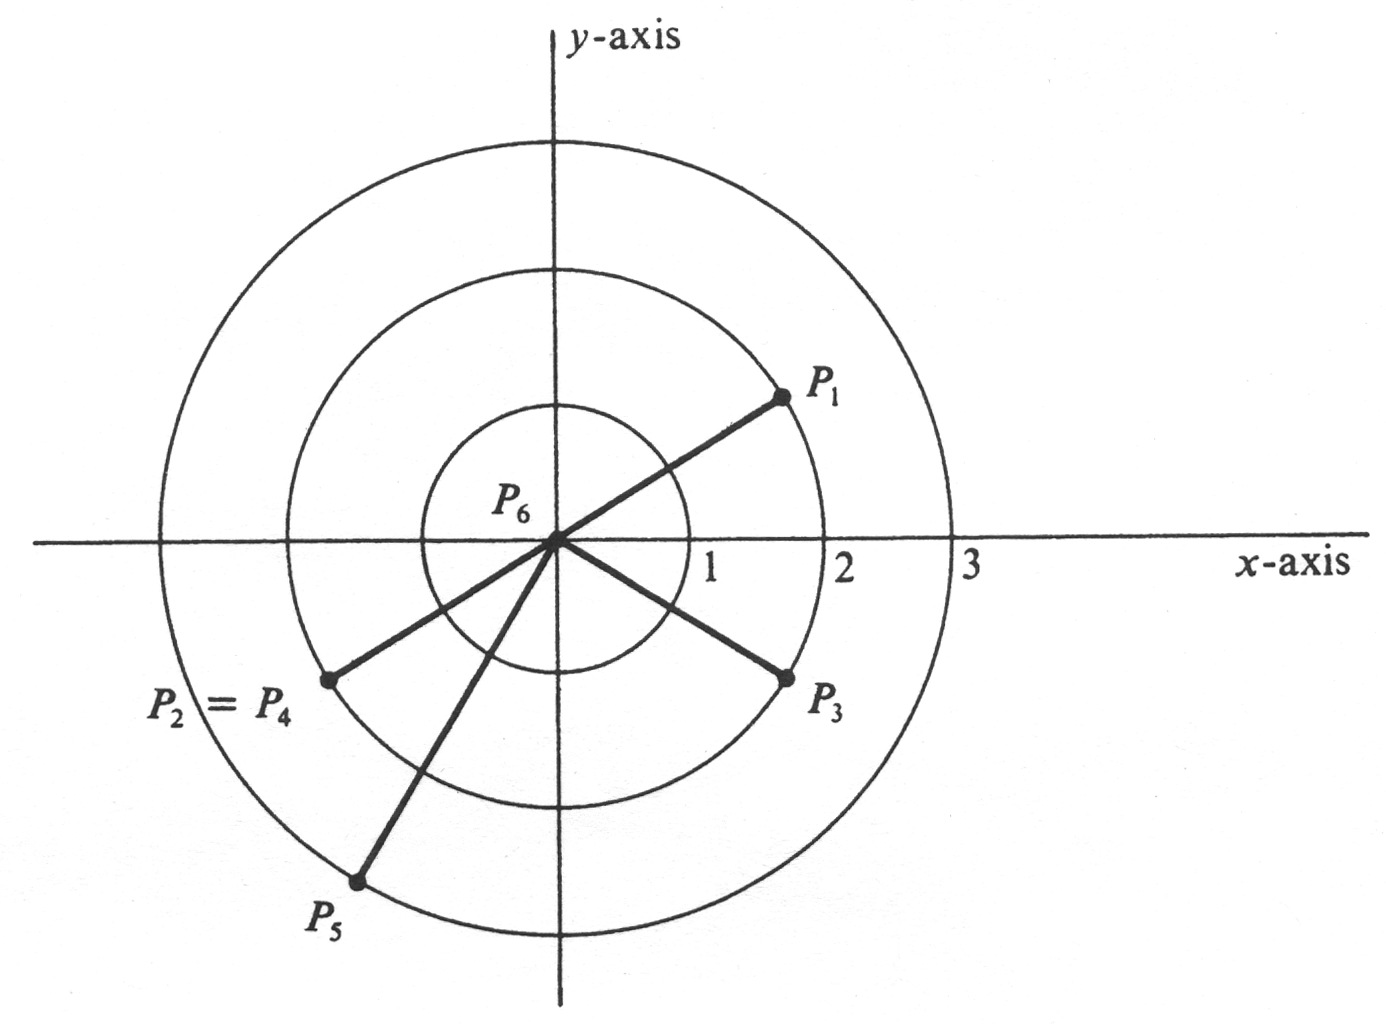
The points are plotted in Figure 25. Note that <math>P_2 = P_4</math> even though the polar coordinates defining them are different. Although we have found the rectangular coordinates of each point, these are not necessary for plotting. For example, the point <math>P_1</math> with polar coordinates <math> \Big(2, \frac{\pi}{6} \Big)</math> is most easily plotted by drawing from the origin the line segment of length 2, which makes an angle of <math>\frac{\pi}{6}</math> radians with the positive <math>x</math>-axis. | |||
<div id="fig 10.25" class="d-flex justify-content-center"> | |||
[[File:guide_c5467_scanfig10_25.png | 400px | thumb | ]] | |||
</div> | |||
We next study curves in the plane defined by equations in polar coordinates. Let <math>F</math> be a real-valued function of two real variables. The set of all points in the plane whose polar coordinates satisfy the equation | |||
<span id{{=}}"eq10.6.2"/> | |||
<math display="block"> | |||
\begin{equation} | |||
F(r, \theta) = 0 | |||
\label{eq10.6.2} | |||
\end{equation} | |||
</math> | |||
will be called the '''graph in polar coordinates,''' or simply, the '''polar graph''' of the equation. More formally: The polar graph of equation (2) is the set of all points <math>P = (x, y)</math> for which there exists a pair <math>(r, \theta)</math> such that <math>F(r, \theta) = 0</math> and | |||
<math display="block"> | |||
\left \{\begin{array}{c} | |||
x = r \cos \theta,\\ | |||
y = r \sin \theta. | |||
\end{array} | |||
\right . | |||
</math> | |||
Frequently, <math>r</math> is explicitly defined as a function of <math>\theta</math>. This means that there is a real-valued function <math>f</math> of one real variable, and we consider the equation | |||
<span id{{=}}"eq10.6.3"/> | |||
<math display="block"> | |||
\begin{equation} | |||
r = f(\theta) . | |||
\label{eq10.6.3} | |||
\end{equation} | |||
</math> | |||
The '''polar graph''' of this equation is that of the equation <math>r - f(\theta) = 0</math>, which is a special case of equation (2) in the preceding paragraph. It follows that the polar graph of <math>r = f (\theta)</math> is the set of all points <math>(x, y)</math> such that | |||
<span id{{=}}"eq10.6.4"/> | |||
<math display="block"> | |||
\begin{equation} | |||
\left \{ \begin{array}{c} | |||
x = f(\theta) \cos \theta, \\ | |||
y = f(\theta) \sin \theta, | |||
\end{array} | |||
\right . | |||
\label{eq10.6.4} | |||
\end{equation} | |||
</math> | |||
for every <math>\theta</math> in the domain of <math>f</math>. If <math>f</math> is a continuous function with domain an interval of real numbers, then equations (4) constitute a parametrization, and so the polar graph of <math>r = f(\theta)</math> is a parametrized curve. | |||
<span id="eq10.6.5"/> | |||
'''Example''' | |||
Identify and draw the curve defined by the equation | |||
<span id{{=}}"eq10.6.5"/> | |||
<math display="block"> | |||
\begin{equation} | |||
r = 4 \cos \theta | |||
\label{eq10.6.5} | |||
\end{equation} | |||
</math> | |||
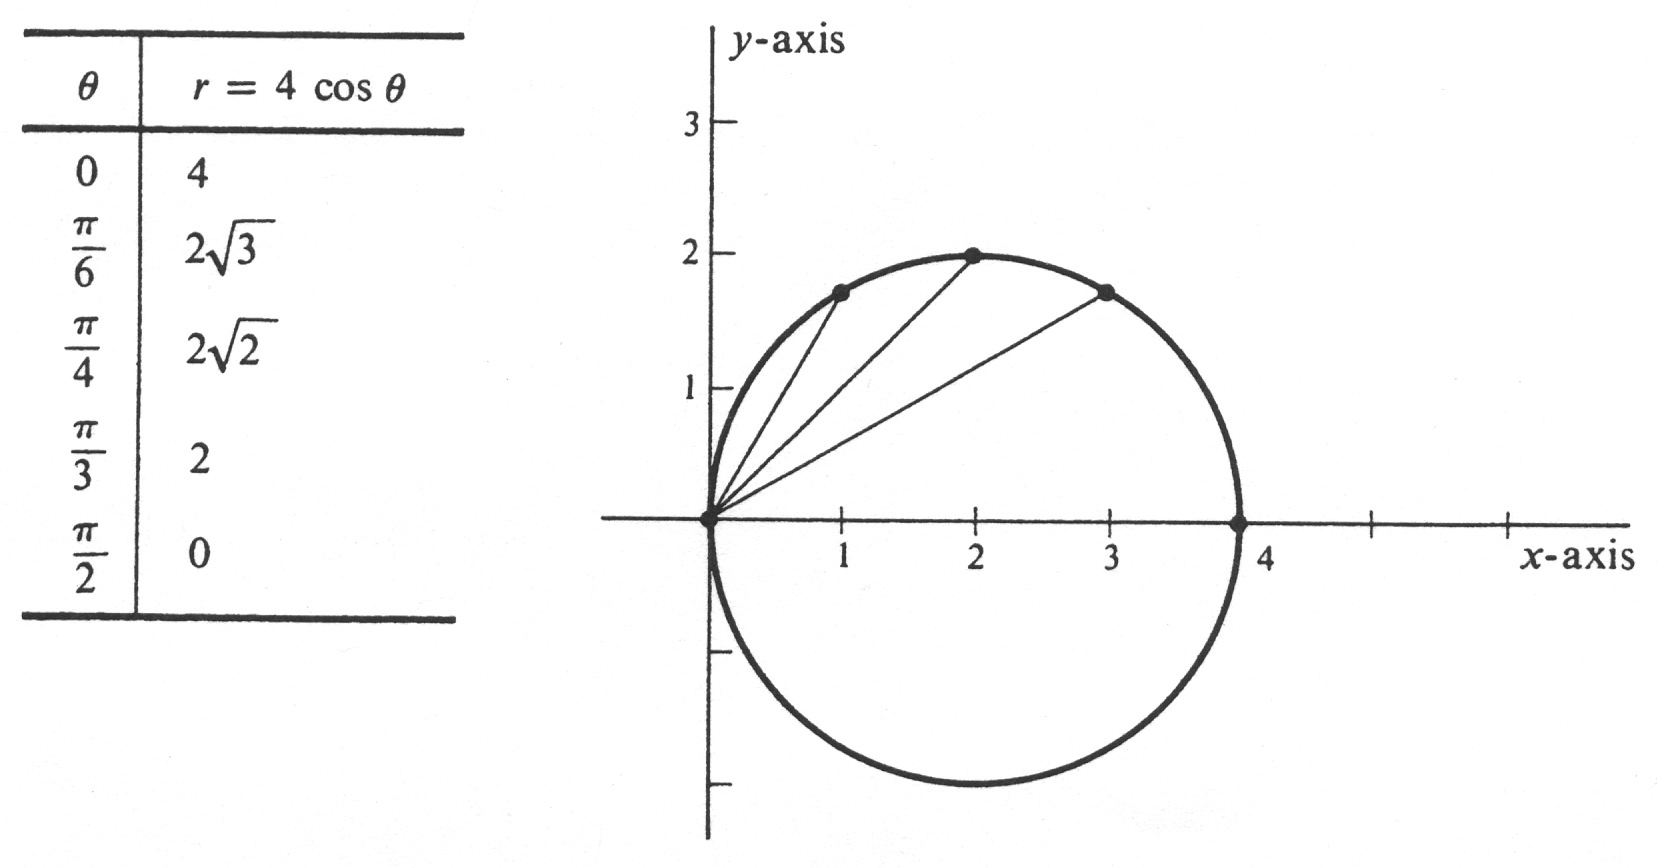
in polar coordinates. By the curve defined by an equation <math>r = f(\theta)</math> in polar coordinates we mean, of course, the polar graph of <math>r = f(\theta)</math>. A partial list of values of <math>\theta</math> and <math>r</math> which satisfy equation (5) is given in Figure 26, and the points which have these pairs as polar coordinates are plotted. ''Since the cosine is an even, function, i.e., since $\cos(-\theta) = \cos \theta$, it follows that the resulting curce is symmetric about the $x$-axis.'' The periodicity of the cosine implies that we may limit values of <math>\theta</math> to an interval of length <math>2\pi</math>. However, we can do considerably better than that. The fact that | |||
<math display="block"> | |||
\cos(\theta + \pi) = -\cos \theta | |||
</math> | |||
implies that if <math>r = 4 \cos \theta</math>, then <math>-r = 4 \cos(\theta + \pi)</math>. But we have already observed that <math>(r, \theta)</math> and <math>(-r, \theta + \pi)</math> are polar coordinates of the same point. lt follows that all the points of the curve will be included even if the values of <math>\theta</math> are limited to the interval <math>[-\frac{\pi}{2}, \frac{\pi}{2}]</math>. Finally, in view of the symmetry about the <math>x</math>-axis, it is sufficient in plotting points to consider only values in <math>[0,\frac{\pi}{2}]</math>. | |||
It appears from Figure 26 that the polar graph of <math>r = 4 \cos \theta</math> is the circle of radius 2 with center at the point <math>P = (2, 0)</math>. This can be verified as follows: An equation with the same polar graph is | |||
<span id{{=}}"eq10.6.6"/> | |||
<math display="block"> | |||
\begin{equation} | |||
r^2 = 4r \cos \theta. | |||
\label{eq10.6.6} | |||
\end{equation} | |||
</math> | |||
Since <math>x = r \cos \theta, y = r \sin \theta</math>, and <math>x^2 + y^2 = r^2</math>, the polar graph of (6) is the same as the graph of the equation | |||
<math display="block"> | |||
x^2 + y^2 = 4x | |||
</math> | |||
in rectangular coordinates. This equation is equivalent to | |||
<math display="block"> | |||
x^2 - 4x + 4 + y^2 = 4, | |||
</math> | |||
Figure 26 | |||
<div id="fig 10.26" class="d-flex justify-content-center"> | |||
[[File:guide_c5467_scanfig10_26.png | 400px | thumb | ]] | |||
</div> | |||
which is the same as | |||
<math display="block"> | |||
(x - 2)^2 + y^2 = 2^2. | |||
</math> | |||
The latter is the standard form of the equation of the circle of radius 2 with center at (2, 0). | |||
<span id="eq10.6.7"/> | |||
'''Example''' | |||
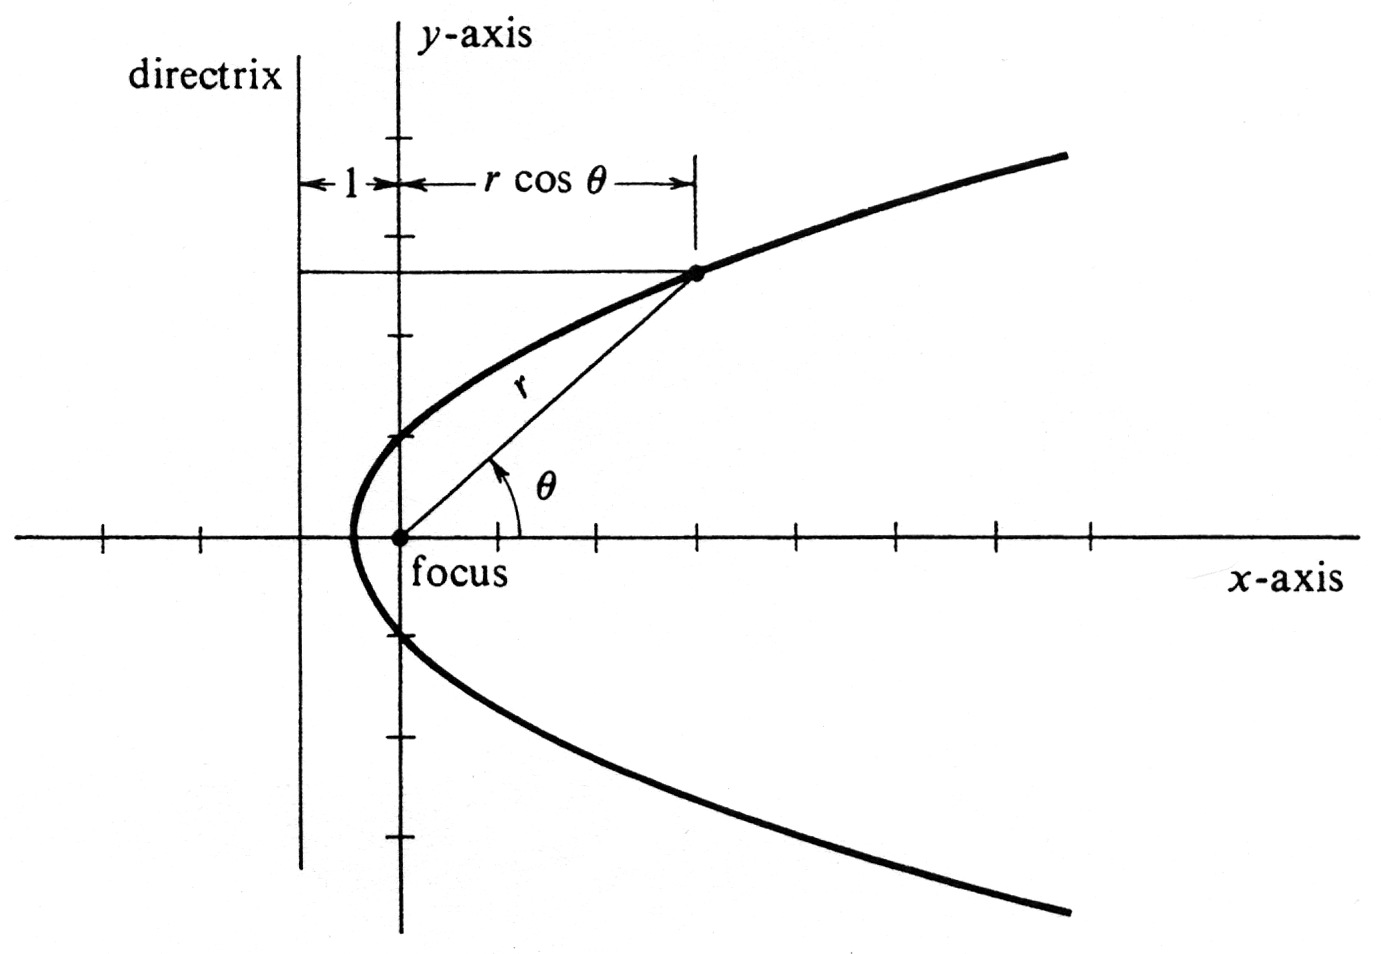
A parabola is by definition the set of all points in the plane which are equidistant from a fixed line and a fixed point not on the line (see page 136). The line is called the directrix, and the point the focus. Find an equation in polar coordinates of the parabola whose focus is the origin and whose directrix is the vertical line cutting the <math>x</math>-axis in the point (-1, 0). The parabola is drawn in Figure 27. | |||
An equation of a curve in polar coordinates means an equation <math>F(r, \theta) = 0</math> whose polar graph is the given curve. In the present example, let <math>(r, \theta)</math>, with <math>r > 0</math>, be a pair of polar coordinates of an arbitrary point on the parabola. Then <math>r</math> is the distance from the point to the focus, and, as can be seen from the figure, the distance from the point to the directrix is <math>1 + r \cos \theta</math>. Hence the geometric condition which defines the parabola is expressed in polar coordinates by the equation | |||
<math display="block"> | |||
r = 1 + r \cos \theta, | |||
</math> | |||
which is equivalent to | |||
<math display="block"> | |||
r (1 - \cos \theta) = 1, | |||
</math> | |||
and thence to | |||
<span id{{=}}"eq10.6.7"/> | |||
<math display="block"> | |||
\begin{equation} | |||
r = \frac{1}{1 - \cos \theta} . | |||
\label{eq10.6.7} | |||
\end{equation} | |||
</math> | |||
<div id="fig 10.27" class="d-flex justify-content-center"> | |||
[[File:guide_c5467_scanfig10_27.png | 400px | thumb | ]] | |||
</div> | |||
Conversely, if <math>r</math> and <math>\theta</math> satisfy equation (7), it is clear that they are the polar coordinates of a point which satisfies the conditions for Iying on the parabola. | |||
<span id="fig 10.28"/> | |||
'''Example''' | |||
Draw the curve defined by the equation | |||
<math display="block"> | |||
r = a \theta, \;\;\; - \infty < \theta < \infty, | |||
</math> | |||
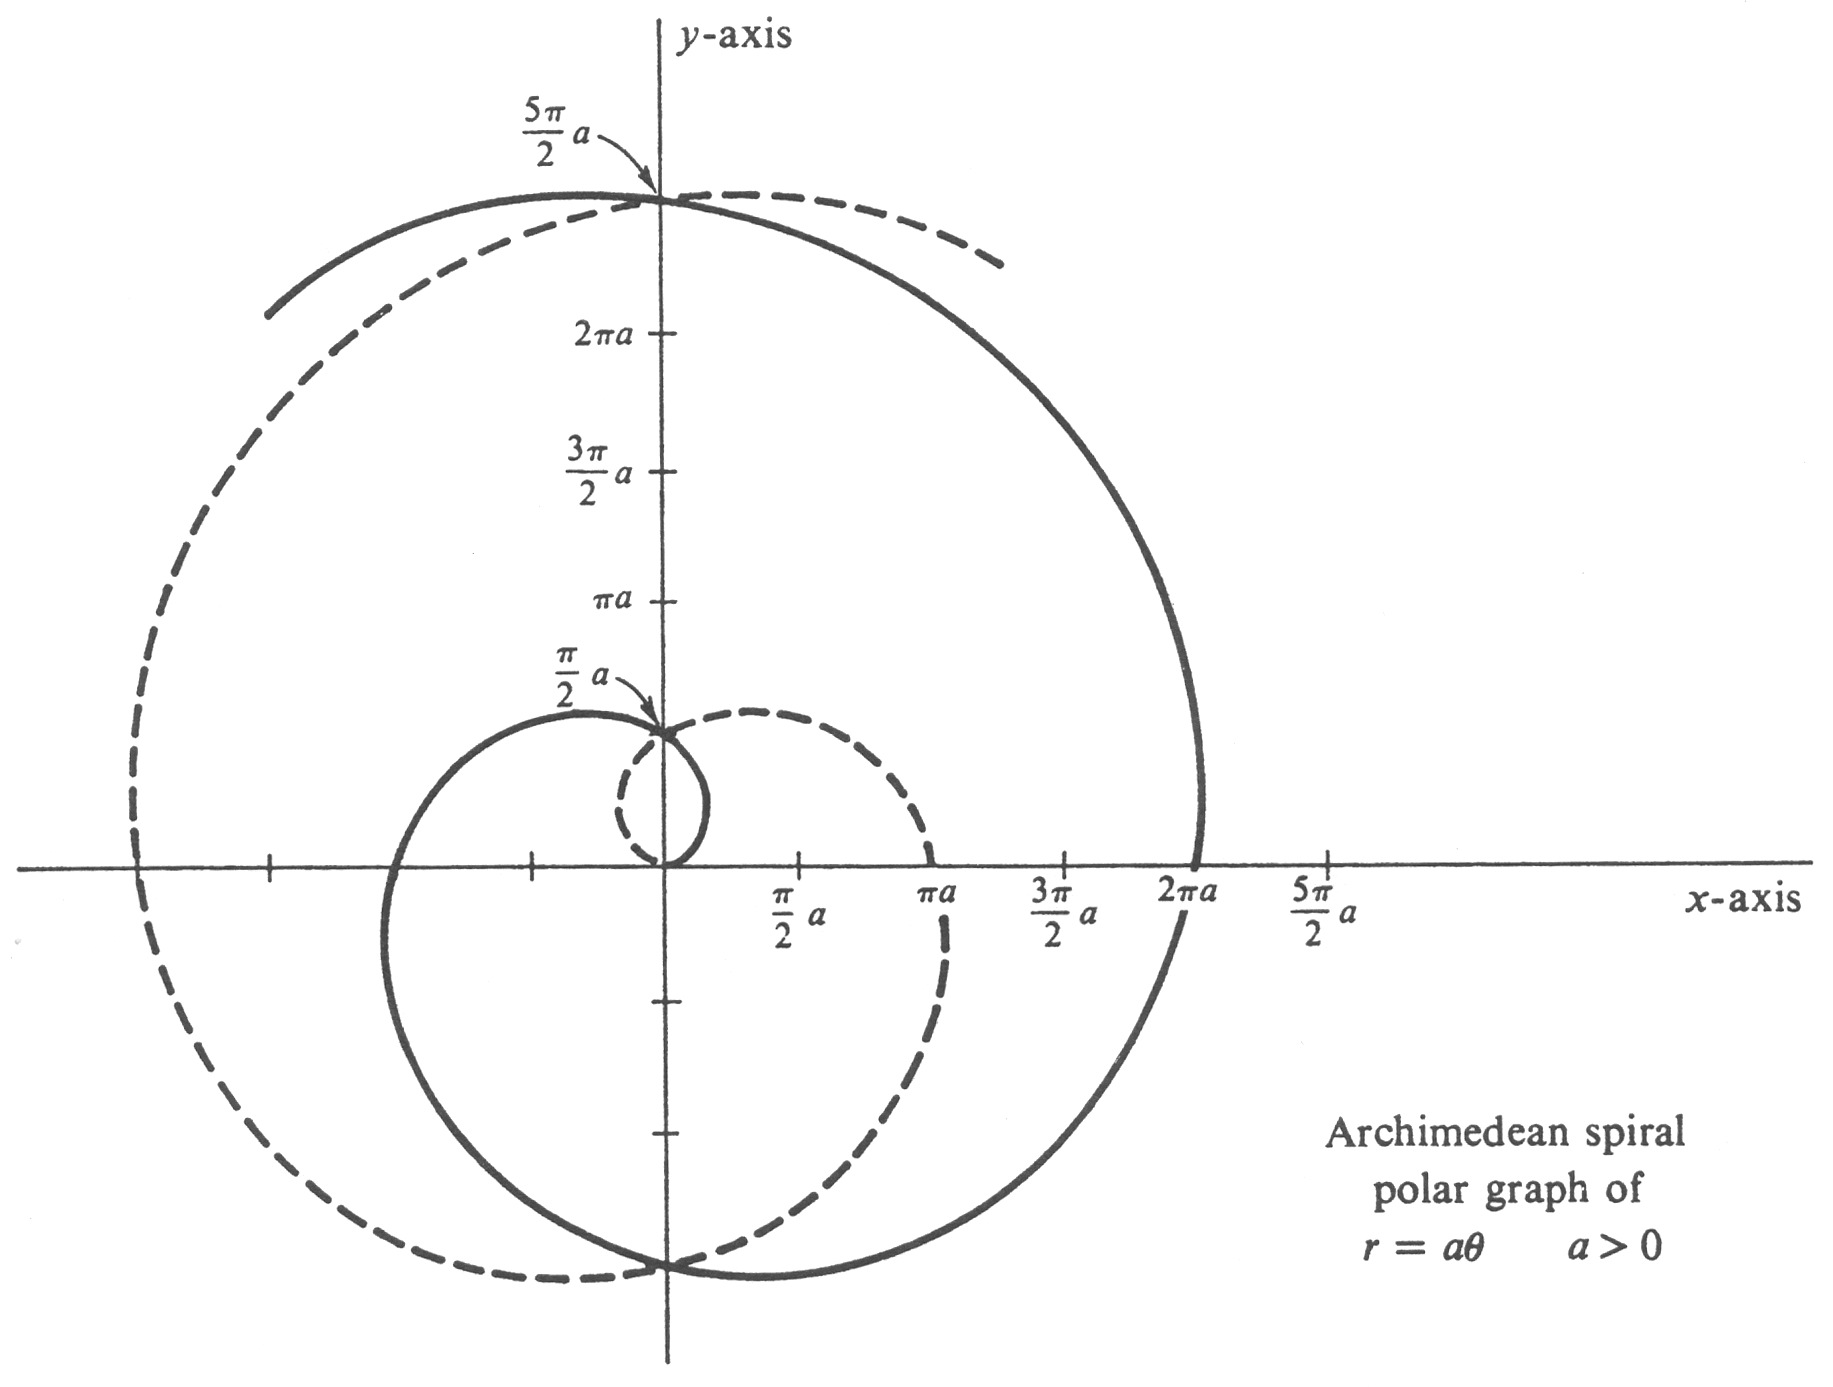
in polar coordinates, where <math>a</math> is some positive constant. The polar graph of this equation is called an '''Archimedean spiral.''' If <math>\theta = 0</math>, then <math>r = a \cdot 0 = 0</math>, and we conclude that the origin is a point on the curve. As <math>\theta</math> increases from zero, so does <math>r</math>, and it follows that a spiral is traced out in the counterclockwise direction. This part of the curve is drawn with a solid line in Figure 28. Thus the curve drawn with the solid line is the polar graph of the equation | |||
<math display="block"> | |||
r = a\theta, \;\;\; 0 \leq \theta < \infty. | |||
</math> | |||
For negative <math>\theta</math>, the polar graph of <math>r = a\theta</math> is obtained by reflecting the graph for positive <math>\theta</math> about the <math>y</math>-axis. This part of the curve, indicated by a dashed dine in the figure, is a spiral in the clockwise direction. One way to verify this assertion of symmetry about the <math>y</math>-axis is to write the equations which define the curve parametrically. They are | |||
<math display="block"> | |||
\left \{ \begin{array}{ll} | |||
x = r \cos \theta = a\theta \cos \theta, &\\ | |||
y = r \sin \theta = a\theta \sin \theta, \;\;\;& -\infty < \theta < \infty . | |||
\end{array} | |||
\right . | |||
</math> | |||
That is, we have a parametrization | |||
<math display="block"> | |||
P(\theta) = (x(\theta), y(\theta)) = (a\theta \cos \theta, a\theta \sin \theta), | |||
</math> | |||
<div id="fig 10.28" class="d-flex justify-content-center"> | |||
[[File:guide_c5467_scanfig10_28.png | 400px | thumb | ]] | |||
</div> | |||
for every real number <math>\theta</math>. Since the functions cosine and sine are, respectively, even and odd, we obtain | |||
<math display="block"> | |||
\begin{eqnarray*} | |||
x(-\theta) &=& a(-\theta) \cos(-\theta) = -a\theta \cos \theta = -x(\theta), \\ | |||
y(-\theta) &=& a(-\theta) \sin(-\theta) = -a\theta (-\sin \theta) = y(\theta). | |||
\end{eqnarray*} | |||
</math> | |||
It follows that the point <math>P(-\theta) = (-x(\theta), y(\theta))</math> is situated symmetrically across the <math>y</math>-axis from the point <math>P(\theta) = (x(\theta), y(\theta))</math>, and thus the curve is symmetric about the <math>y</math>-axis. | |||
<span id="fig 10.29"/> | |||
'''Example''' | |||
Draw the curve, called a '''lemniscate''', defined by the equation | |||
<math display="block"> | |||
r^2 = 2a^2 \cos 2\theta, \;\;\; a \neq 0, | |||
</math> | |||
in polar coordinates. | |||
We first observe that the polar graph of this equation is symmetric about the origin; i.e., if the pair <math>(r, \theta)</math> satisfies the equation, then so does <math>(-r, \theta)</math>. This fact is a consequence of the equations | |||
<math display="block"> | |||
r^2 = 2a^2 \cos 2\theta = (-r)^2. | |||
</math> | |||
In addition, if <math>(r, \theta)</math> satisfies the equation, then so does <math>(r, -\theta)</math>, since the cosine is an even function. Thus the polar graph is also symmetric about the <math>x</math>-axis. It follows from these observations of symmetry that the entire curve | |||
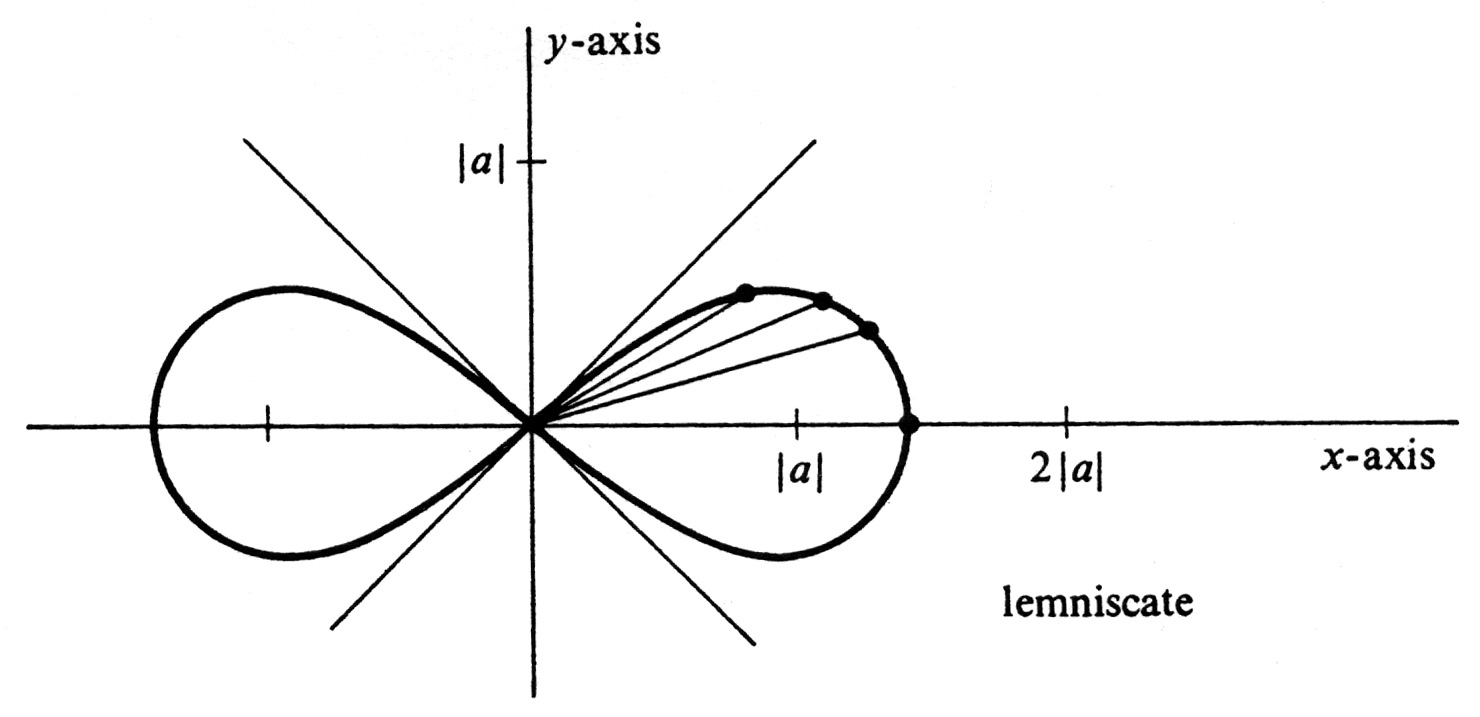
is obtained from that part which lies in the first quadrant of the <math>xy</math>-plane (those points for which <math>x \geq 0</math> and <math>y \geq 0</math>) by reflecting about both the <math>x</math>-axis and the <math>y</math>-axis. Moreover, any point on the curve in the first quadrant has polar coordinates for which <math>r \geq 0</math> and <math>0 \leq \theta \leq \frac{\pi}{2}</math> Finally, if <math>(r, \theta)</math> satisfies the equation, then | |||
<math display="block"> | |||
\cos 2\theta = \frac{r^2}{2a^2} \geq 0 . | |||
</math> | |||
However, for values of <math>\theta</math> in the interval <math>\Bigl[0, \frac{\pi}{2}\Bigr], \cos 2\theta</math> is nonnegative only if <math>0 \leq \theta \leq \frac{\pi}{4}</math>. We conclude that the entire curve is obtained by symmetry from those points which have polar coordinates <math>(r, \theta)</math> with <math>r \geq 0</math> and <math>0 \leq \theta \leq \frac{\pi}{4}</math>. A partial list of such pairs is given in Table 2, and the corresponding points are shown on the curve in Figure 29. | |||
<div id="fig 10.29" class="d-flex justify-content-center"> | |||
[[File:guide_c5467_scanfig10_29.png | 400px | thumb | ]] | |||
</div> | |||
\setcounter{table}{1} | |||
<span id="table 10.2"/> | |||
{|class="table" | |||
|- | |||
|<math>\theta</math> || <math>r = \sqrt{2a^2 \cos{2\theta}}</math> || Approximate value \vspace {1ex} | |||
|- | |||
|0 || <math>\sqrt2 \;|a|</math> || <math>1.4\;|a|</math> \vspace {1ex} | |||
|- | |||
|<math>\frac{\pi}{12}</math> || <math>\sqrt2 \;|a|\;\Bigl(\frac{\sqrt3}{2}\Bigr)^{1/2} = \sqrt[4]{3} \;|a|</math> || <math>1.3\;|a|</math> \vspace {1ex} | |||
|- | |||
|<math>\frac{\pi}{8}</math> || <math>\sqrt2 \;|a|\;\Bigl(\frac{\sqrt2}{2}\Bigr)^{1/2} = \sqrt[4]{2} \;|a|</math> || <math>1.2\;|a|</math> \vspace {1ex} | |||
|- | |||
|<math>\frac{\pi}{6}</math> || <math>\sqrt2 \;|a|\;(\frac{1}{2})^{1/2} = |a|</math> || <math>|a|</math> \vspace {1ex} | |||
|- | |||
|<math>\frac{\pi}{4}</math> || 0 || 0 \vspace {1ex} | |||
|} | |||
\end{exercise} | |||
==General references== | |||
{{cite web |title=Crowell and Slesnick’s Calculus with Analytic Geometry|url=https://math.dartmouth.edu/~doyle/docs/calc/calc.pdf |last=Doyle |first=Peter G.|date=2008 |access-date=Oct 29, 2024}} | |||
Revision as of 01:09, 3 November 2024
Polar Coordinates.
Since the set [math]R^2[/math] of all ordered pairs of real numbers has been identified with the set of all points in the plane, every point is uniquely determined by its [math]x[/math]- and [math]y[/math]-coordinates. An alternative way of specifying points in the plane is the following: To every ordered pair [math](r, \theta)[/math] of real numbers, we assign the point [math]P = (x, y)[/math] in [math]R^2[/math] defined by
The pair [math](r, \theta)[/math] is called a pair of polar coordinates of the point [math]P = (x, y)[/math]. In giving the geometric interpretation of polar coordinates of a point, we distinguish three separate possibilities: Case 1. [math]r \gt 0[/math]. Then [math]r[/math] is the distance between [math]P = (x, y)[/math] and the origin, since
The number [math]\theta[/math] is the radian measure of the angle which has its vertex at the origin, its initial side the positive [math]x[/math]-axis, and its terminal side the line segment joining the origin to [math]P[/math]. An example is shown in Figure 22.
Case 2. [math]r = 0[/math]. Then [math]P[/math] is the origin regardless of the value of [math]\theta[/math], since
\setcounter{figure}{21}
Case 3. [math]r \lt 0[/math]. In this case the point [math]P = (x, y)[/math] is symmetric with respect to the origin to the point with polar coordinates [math](|r|, \theta)[/math]. This fact is illustrated in Figure 23. To prove it, we first observe that
In the present situation r is negative. Hence [math]-r[/math] is positive, and [math]|r| = -r[/math]. The preceding equations therefore imply
Thus
and this is precisely what is asserted above.
The major difference between polar coordinates and the familiar [math]x[/math]- and [math]y[/math]-coordinates is that if a given point [math]P = (x, y)[/math] has one pair of polar coordinates [math](r, \theta)[/math], then it has infinitely many: If [math]n[/math] is any integer, then
and it therefore follows that, for every integer [math]n[/math], the ordered pair [math](r, \theta + 2\pi n)[/math] is a pair of polar coordinates for the one point [math]P = (x, y) = (r \cos \theta, r \sin \theta)[/math]. In addition, as shown in Case 3, we have
Hence [math](-r, \theta + \pi)[/math] is also a pair of polar coordinates of [math]P[/math]. We conclude that there is no such thing as the polar coordinates of a point.
Of course, it is also important to realize that every point [math]P = (x, y)[/math] has at least one pair of polar coordinates (and thence infinitely many). This is not hard to show. We set [math]r = \sqrt{x^2 + y^2}[/math]. If [math]r = 0[/math], then [math]x = y = 0[/math] and [math]P[/math] is the origin. In this case, [math](r, \theta) = (0, \theta)[/math] is a pair of polar coordinates of [math]P[/math] for any choice of [math]\theta[/math]. If [math]r \gt 0[/math], then [math]P[/math] is not the origin, and we let [math]Q[/math] be the point on the unit circle (defined by [math]x^2 + y^2 = 1[/math]) which lies on the half-line emanating from the origin and passing through [math]P[/math] (see Figure 24). From our definition of the functions sine and cosine, we know that [math]Q = (\cos \theta, \sin \theta)[/math] for some number [math]\theta[/math]. It follows that
and so [math](r, \theta)[/math] is a pair of polar coordinates of [math]P[/math].
Example Determine the [math]x[/math]- and [math]y[/math]-coordinates of the points with the following polar coordinates, and plot the points in the plane.
If [math](r, \theta)[/math] is a pair of polar coordinates of a point [math]P[/math], then the [math]x[/math]- and [math]y[/math]-coordinates of [math]P[/math] are given by
We next study curves in the plane defined by equations in polar coordinates. Let [math]F[/math] be a real-valued function of two real variables. The set of all points in the plane whose polar coordinates satisfy the equation
Frequently, [math]r[/math] is explicitly defined as a function of [math]\theta[/math]. This means that there is a real-valued function [math]f[/math] of one real variable, and we consider the equation
The polar graph of this equation is that of the equation [math]r - f(\theta) = 0[/math], which is a special case of equation (2) in the preceding paragraph. It follows that the polar graph of [math]r = f (\theta)[/math] is the set of all points [math](x, y)[/math] such that
Example Identify and draw the curve defined by the equation
in rectangular coordinates. This equation is equivalent to
which is the same as
Example
A parabola is by definition the set of all points in the plane which are equidistant from a fixed line and a fixed point not on the line (see page 136). The line is called the directrix, and the point the focus. Find an equation in polar coordinates of the parabola whose focus is the origin and whose directrix is the vertical line cutting the [math]x[/math]-axis in the point (-1, 0). The parabola is drawn in Figure 27. An equation of a curve in polar coordinates means an equation [math]F(r, \theta) = 0[/math] whose polar graph is the given curve. In the present example, let [math](r, \theta)[/math], with [math]r \gt 0[/math], be a pair of polar coordinates of an arbitrary point on the parabola. Then [math]r[/math] is the distance from the point to the focus, and, as can be seen from the figure, the distance from the point to the directrix is [math]1 + r \cos \theta[/math]. Hence the geometric condition which defines the parabola is expressed in polar coordinates by the equation
Conversely, if [math]r[/math] and [math]\theta[/math] satisfy equation (7), it is clear that they are the polar coordinates of a point which satisfies the conditions for Iying on the parabola.
Example Draw the curve defined by the equation
for every real number [math]\theta[/math]. Since the functions cosine and sine are, respectively, even and odd, we obtain
It follows that the point [math]P(-\theta) = (-x(\theta), y(\theta))[/math] is situated symmetrically across the [math]y[/math]-axis from the point [math]P(\theta) = (x(\theta), y(\theta))[/math], and thus the curve is symmetric about the [math]y[/math]-axis.
Example Draw the curve, called a lemniscate, defined by the equation
\setcounter{table}{1}
| [math]\theta[/math] | [math]r = \sqrt{2a^2 \cos{2\theta}}[/math] | Approximate value \vspace {1ex} |
| 0 | [math]\sqrt2 \;|a|[/math] | [math]1.4\;|a|[/math] \vspace {1ex} |
| [math]\frac{\pi}{12}[/math] | [math]\sqrt2 \;|a|\;\Bigl(\frac{\sqrt3}{2}\Bigr)^{1/2} = \sqrt[4]{3} \;|a|[/math] | [math]1.3\;|a|[/math] \vspace {1ex} |
| [math]\frac{\pi}{8}[/math] | [math]\sqrt2 \;|a|\;\Bigl(\frac{\sqrt2}{2}\Bigr)^{1/2} = \sqrt[4]{2} \;|a|[/math] | [math]1.2\;|a|[/math] \vspace {1ex} |
| [math]\frac{\pi}{6}[/math] | [math]\sqrt2 \;|a|\;(\frac{1}{2})^{1/2} = |a|[/math] | [math]|a|[/math] \vspace {1ex} |
| [math]\frac{\pi}{4}[/math] | 0 | 0 \vspace {1ex} |
\end{exercise}
General references
Doyle, Peter G. (2008). "Crowell and Slesnick's Calculus with Analytic Geometry" (PDF). Retrieved Oct 29, 2024.
