The Hyperbola
The fourth and last conic section is the hyperbola. By definition a hyperbola is the locus of points in a plane the absolute value of
the difference of whose distances from two given points is a positive constant. The constant must be less than the distance between the two points, since the length of one side of a triangle must be greater than the absolute value of the difference between the lengths of the other two sides. The two given points are called the foci of the hyperbola.
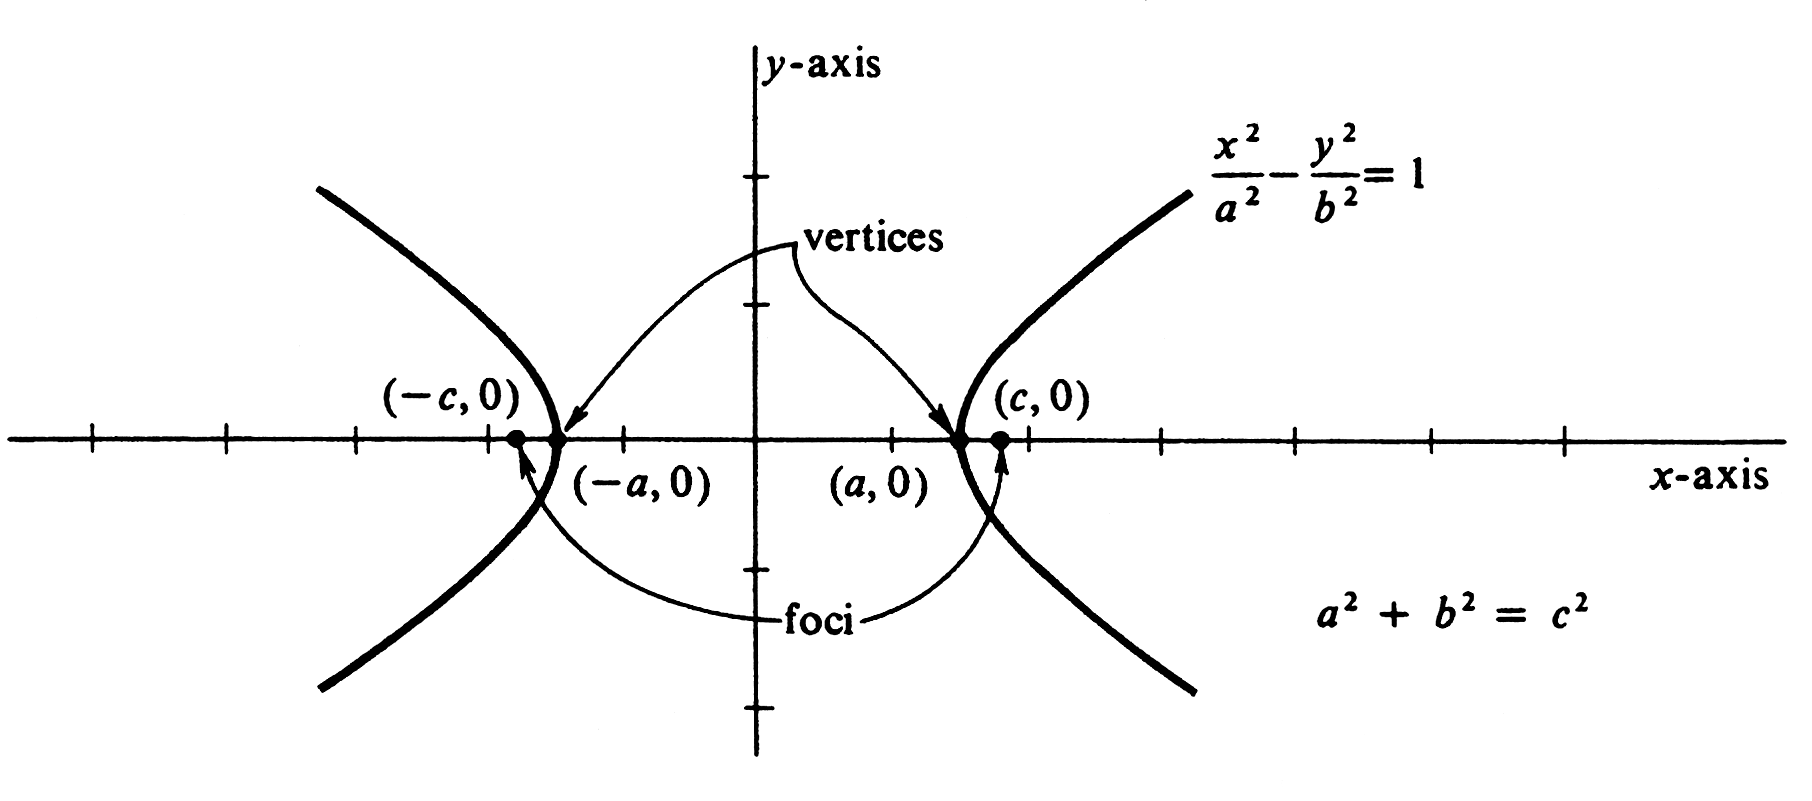
If we select [math](-c, 0)[/math] and [math](c, 0)[/math] as foci and [math]2a[/math] as the difference of distances, the point [math](x, y)[/math] will lie on the hyperbola if and only if
This equation is an abbreviation for the two equations
We shall simplify the first of these two equations and leave as Problem 1 at the end of the section the proof that a similar simplification of the second results in the same equation. The steps are similar to those for the simplification of the defining equation of an ellipse:
and finally
This last equation is closely akin to the equation of an ellipse; however, the second term is [math]\frac{y^2}{c^2 - a^2}[/math] instead of [math]\frac{y^2}{a^2 - c^2}[/math]. For the hyperbola, it is the case that [math]2a \lt 2c[/math] and so [math]a \lt c[/math], and therefore [math]c^2 - a^2 \gt 0[/math]. Thus it is [math]c^2 - a^2[/math] which we replace by [math]b^2[/math] to obtain the canonical equation for the hyperbola
We know, from the derivation, that the graph of this equation contains all points [math](x, y)[/math] such that the distance between [math](c, 0)[/math] and [math](x, y)[/math] is [math]2a[/math] more than the distance between [math](-c, 0)[/math] and [math](x, y)[/math]. In Problem 1 you will be asked to show that the graph also contains all points [math](x, y)[/math] such that the distance between [math](-c, 0)[/math] and [math](x, y)[/math] is [math]2a[/math] more than the distance between [math](c, 0)[/math] and [math](x, y)[/math]. In Problem 3 you will be asked to show that the graph contains only those points. By setting y equal to 0, we see that the graph cuts the [math]x[/math]-axis at [math](-a, 0)[/math] and [math](a, 0)[/math]. These points are called the vertices of the hyperbola and the line segment joining them the transverse axis. By writing the equivalent equation [math]y^2 = \frac{b^2}{a^2} (x^2 - a^2)[/math], we see that there are no points on the graph for [math]|x| \lt a[/math]. Hence the graph cannot cut the [math]y[/math]-axis. The curve is infinite in extent, since there are points on the graph for all [math]x[/math] such that [math]|x| \gt a[/math], and [math]|y|[/math] increases indefinitely as [math]|x|[/math] increases. The curve is symmetric with respect to both axes and to the origin, since [math](-p, q)[/math], [math](p,-q)[/math], and [math](-p,-q)[/math] all lie on the graph whenever [math](p, q)[/math] does. Although the graph is infinite in extent, the central portion of it is sketched in Figure. When we ask for the sketch of a hyperbola, it is the central part which is to be drawn.
The graph of [math]y = \frac{b}{a} \sqrt{x^2 - a^2} [/math] is the upper half of the right branch of the hyperbola for [math]x \geq a[/math] and the upper half of the left branch for [math]x \leq -a[/math]. In each case, since [math]|x| \gt \sqrt{x^2 - a^2}[/math], it is true that [math]\frac{b}{a} |x| \gt \frac{b}{a} \sqrt{x^2 - a^2}[/math]. However, the difference between the two functions [math]\frac{b}{a} |x|[/math] and [math]\frac{b}{a} \sqrt{x^2 - a^2}[/math] gets less and less as [math]|x|[/math] increases. Thus the upper half of the hyperbola lies below the graph of [math]y = \frac{b}{a} |x|[/math] but gets closer to it as [math]|x|[/math] increases. Similarly, the graph of [math]y = -\frac{b}{a}\sqrt{x^2 - a^2}[/math] is the lower half of the hyperbola and it lies above the graph of [math]y = - \frac{b}{a} |x|[/math], but gets closer to it as [math]|x|[/math] increases. The union of the two graphs, those of [math]y = \frac{b}{a} |x|[/math] and [math]y = - \frac{b}{a} |x|[/math], is also the union of the graphs of the straight lines [math]y = -\frac{b}{a} x[/math] and [math]y = - \frac{b}{a} x[/math]. These lines, approached by the hyperbola, are called the asymptotes of the hyperbola. They are of use in sketching the graph of a hyperbola, giving guidelines approached by the hyperbola. They are easily drawn as the diagonals of the rectangle with vertical sides passing through the vertices of the hyperbola and horizontal sides passing through [math](0, -b)[/math] and [math](0, b)[/math].
Example
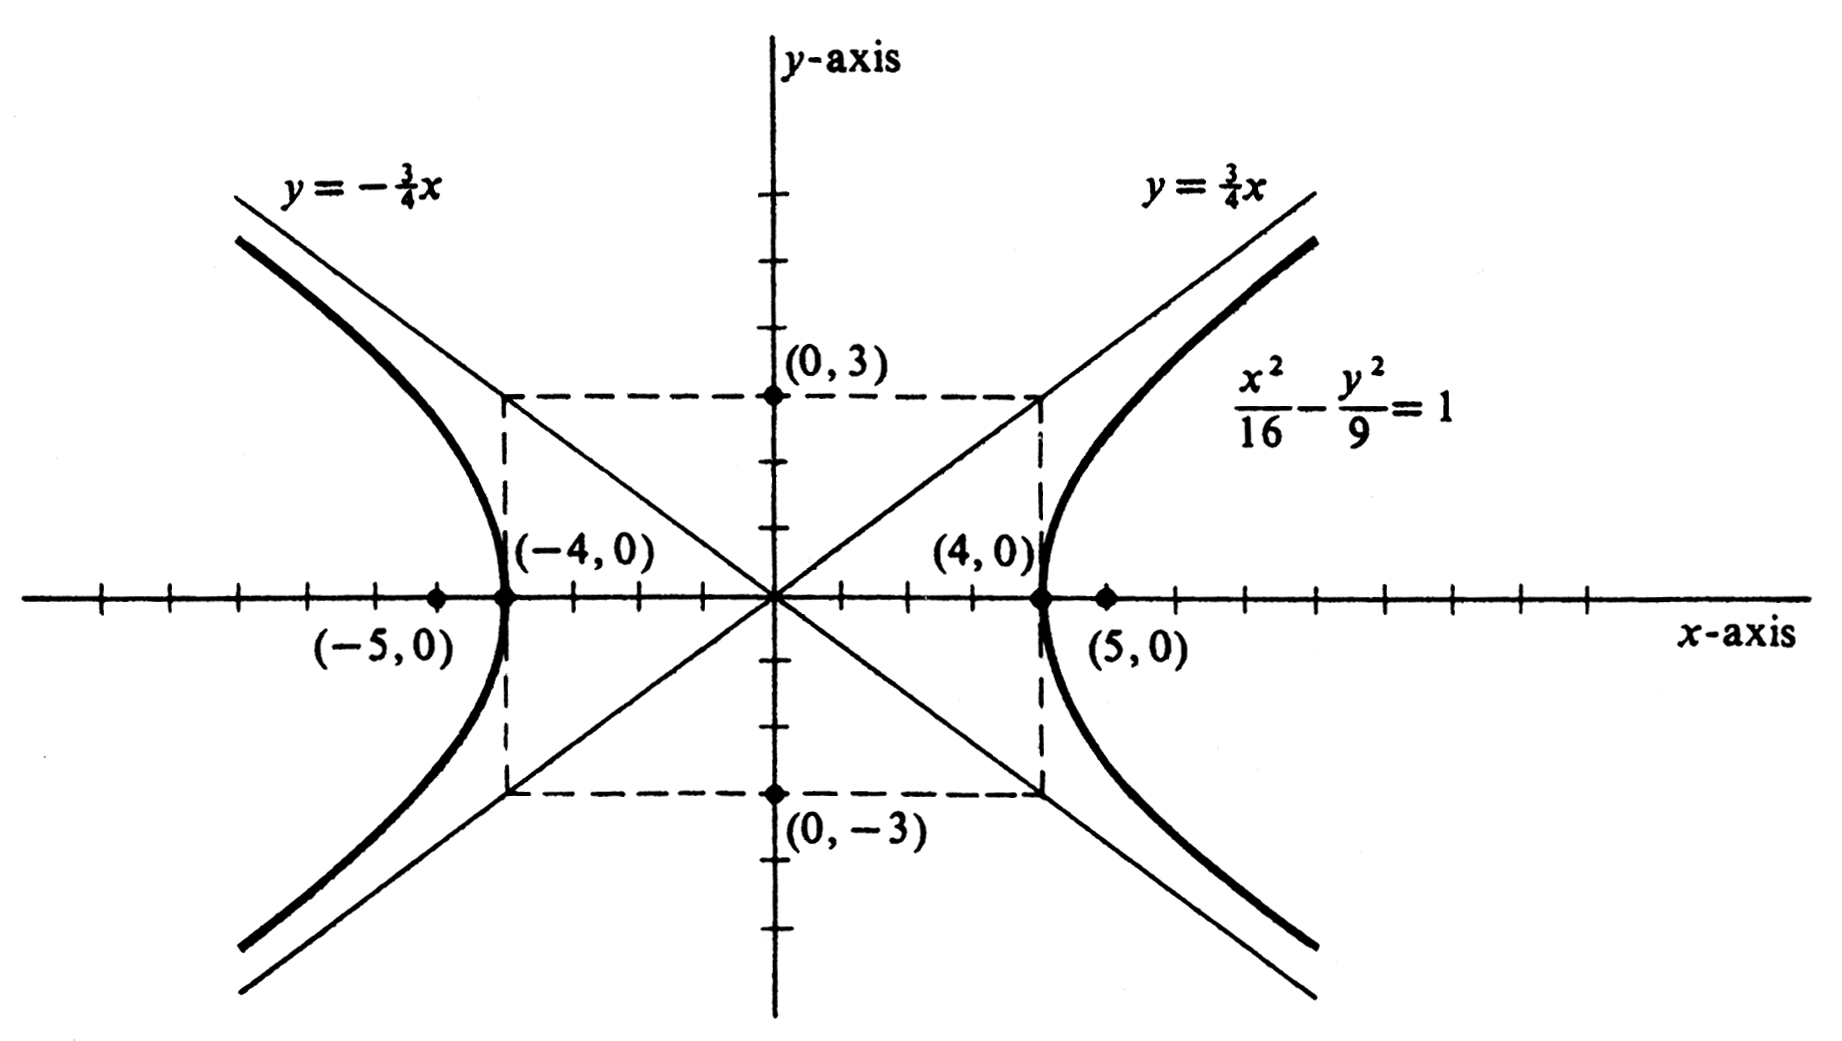
Describe and sketch the graph of [math]\frac{x^2}{16} - \frac{y^2}{9} = 1[/math]. Here we have [math]a = 4[/math], [math]b = 3[/math], and [math]c = 5[/math]. The transverse axis is of length 8, the [math]x[/math]-intercepts are [math]-4[/math] and 4, the foci are at [math](-5, 0)[/math] and (5, 0), and the asymptotes are the lines [math]y = \frac{3}{4}x[/math] and [math]y = - \frac{3}{4}x[/math]. A very useful device for remembering equations of the asymptotes is obtained by replacing the ”1” in the equation of the hyperbola by ”0”:
which is equivalent to
The graph of this equation is the union of the graphs of [math]\frac{x}{4} + \frac{y}{3} = 0[/math] and [math]\frac{x}{4} - \frac{y}{3} = 0[/math], equations of the asymptotes. The graph is sketched in Figure. If the foci of the hyperbola are on the [math]y[/math]-axis, at [math](0, -c)[/math] and [math](0, c)[/math] the equation will be [math]\frac{y^2}{a^2} - \frac{x^2}{b^2} = 1[/math]. The graph will have branches opening upward and downward instead of to the right and left. The lines [math]y = \frac{a}{b}x[/math] and [math]y = -\frac{a}{b} x[/math] will be asymptotes.
Example
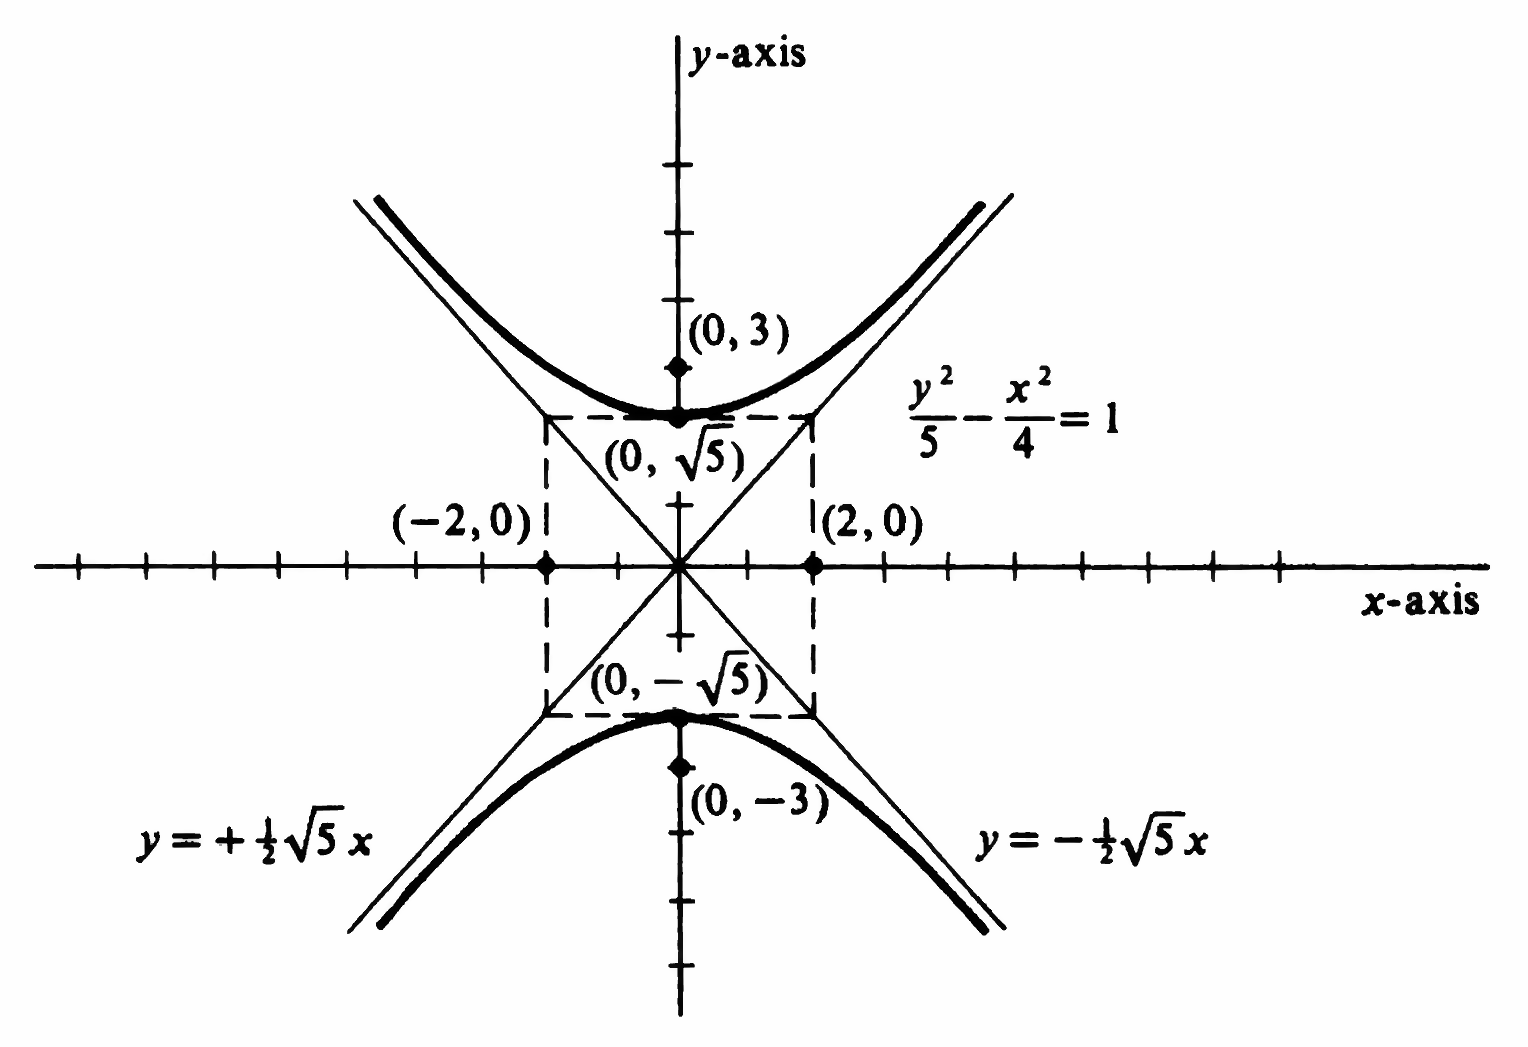
Describe and sketch the graph of [math]4y^2 - 5x^2 = 20[/math]. An equivalent equation is [math]\frac{y^2}{5} - \frac{x^2}{4} = 1[/math], from which we see that the vertices are at [math](0, -\sqrt5)[/math] and [math](0, \sqrt5)[/math]. The transverse axis is vertical and of length [math]2\sqrt{5}[/math]. The foci are at [math](0, -3)[/math] and (0, 3) and the lines [math]y = -\frac{1}{2}\sqrt{5}x[/math] and [math]y = \frac{1}{2}\sqrt{5}x[/math] are the asymptotes. The branches open upward and downward, as can be seen in Figure.
The equations [math]\frac{x^2}{a^2} - \frac{y^2}{b^2} = 1[/math] and [math]\frac{y^2}{b^2} - \frac{x^2}{a^2} = 1[/math] have the same asymptotes, the lines [math]y = -\frac{b}{a} x[/math] and [math]y = - \frac{b}{a} x[/math], and they are called conjugate hyperbola. The first mentioned has its foci at [math](-c, 0)[/math] and [math](c, 0)[/math] and the latter has its foci at [math](0, -c)[/math] and [math](0, c)[/math], where [math]c = \sqrt{a^2 + b^2}[/math]. The transverse axis of each is called the conjugate axis of the other. Examples 1 and 2 have each been a hyperbola with its center at the origin. The foci, however, may be anywhere in the plane and the midpoint of the segment joining them will be the center. If they are on a line parallel to one of the axes, an equation analogous to that of the ellipse can be written. In particular, if the foci are at [math](h - c, k)[/math] and [math](h + c, k)[/math], an equation of the hyperbola is [math]\frac{(x - h)^2}{a^2} - \frac{(y - k)^2}{b^2} = 1[/math], and an equation for the asymptotes is [math] \frac{(x^2 - h^2)}{a^2} - \frac{(y - k^2)}{b^2} = 0[/math]. The latter equation is equivalent to the separate equations, [math]y - k = \frac{b}{a} (x - h)[/math] and [math]y - k = - \frac{b}{a} (x - h)[/math]. If the foci are at [math](h, k - c)[/math] and [math](h, k + c)[/math], an equation for the hyperbola is
Example
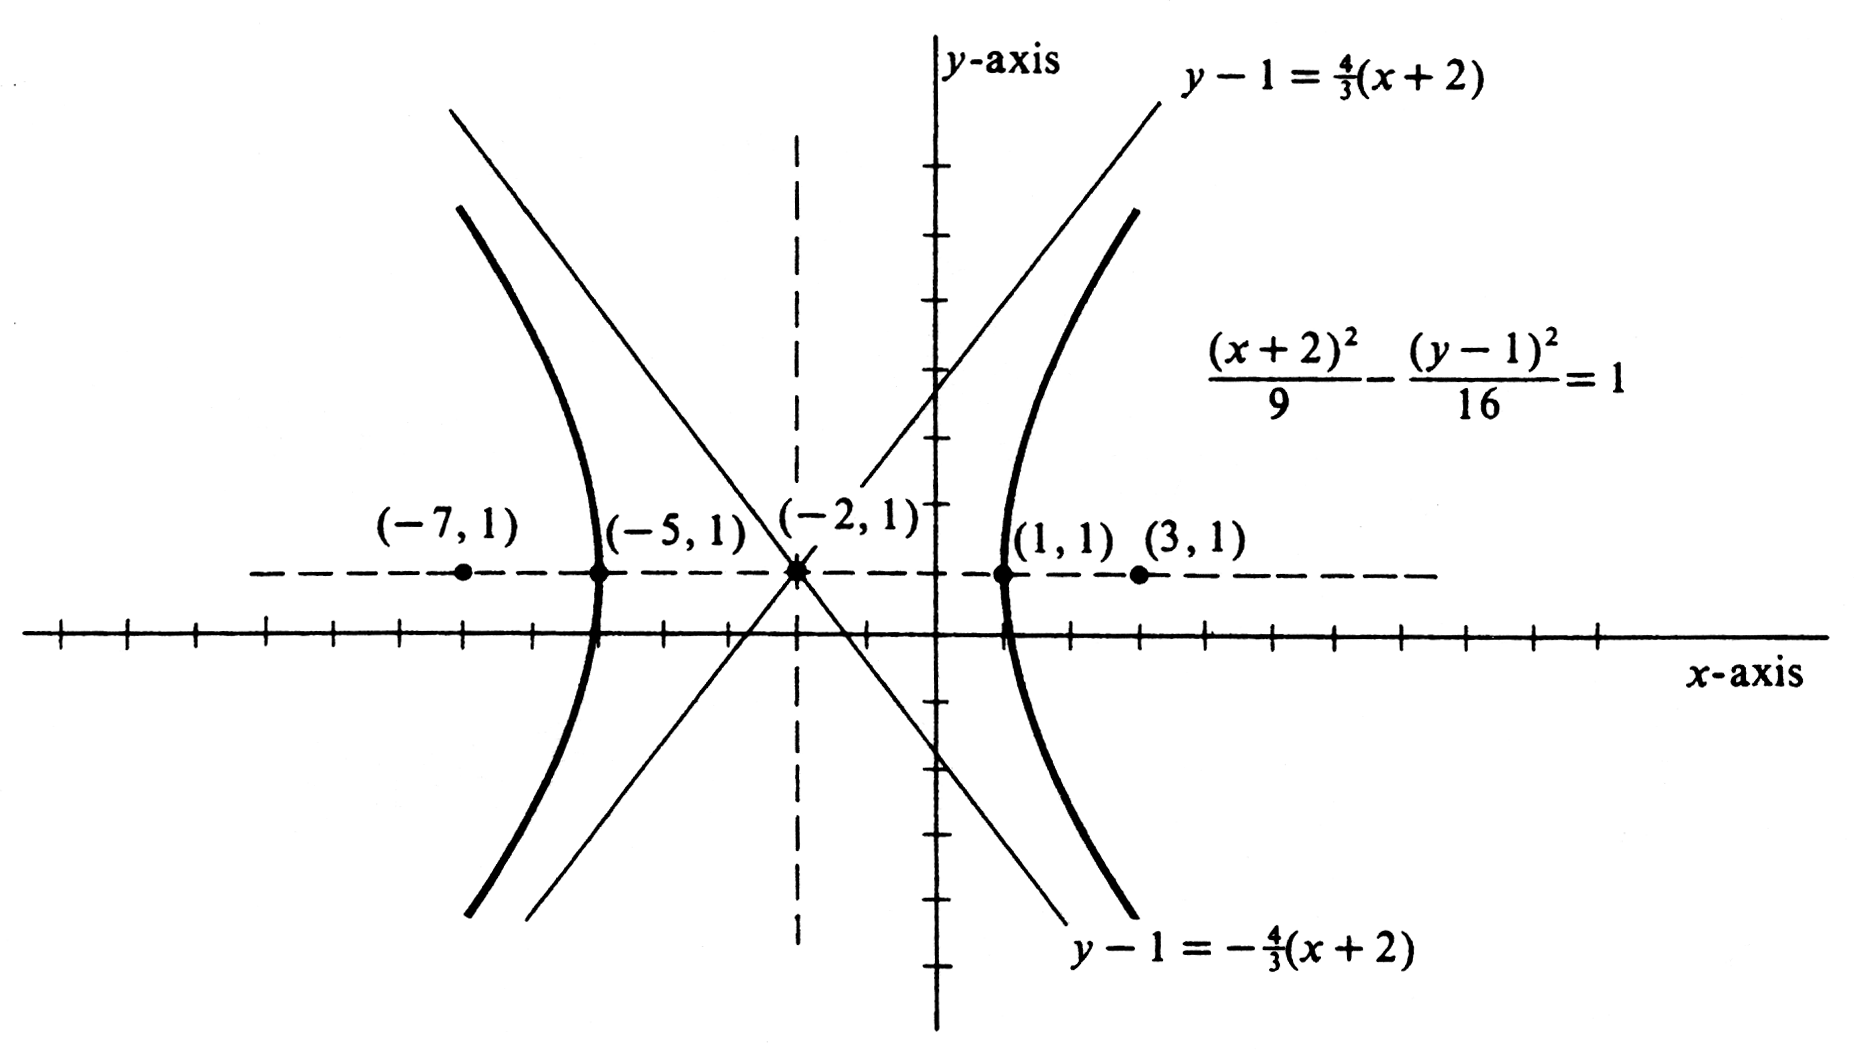
Describe and sketch the graph of [math]\frac{(x + 2)^2}{9} - \frac{(y - 1)^2}{16} = 1[/math]. The center of the hyperbola is at [math](-2, 1)[/math], the foci are at [math](-7, 1)[/math] and (3, 1), and the transverse axis is horizontal and of length 6. The asymptotes have equations [math]y - 1 = \frac{4}{3}(x + 2)[/math] and [math]y - 1 = - \frac{4}{3} (x + 2)[/math]. The graph is sketched in Figure. There is a focus-directrix definition of the hyperbola, analogous to those for the parabola and the ellipse. The distance from a point [math](x, y)[/math] to the focus [math](c, 0)[/math] is [math]\sqrt{(x - c)^2 + y^2}[/math]. The point lies on the hyperbola if and only if [math]\frac{x^2}{a^2} - \frac{y^2}{c^2 - a^2} = 1[/math], or [math]y^2 = a^2 - c^2 - x^2 + \frac{c^2}{a^2} x^2[/math]. Thus the distance from a point on the hyperbola to the focus is
As with the ellipse, this distance is equal to [math]\frac{c}{a} \Bigl|x - \frac{a^2}{c}\Bigr|[/math], or [math]\frac{c}{a}[/math] times the distance to the line [math]x = \frac{a^2}{c}[/math]. This line is again called the directrix, and the ratio [math]\frac{c}{a}[/math] the eccentricity. However, for the hyperbola the eccentricity is greater than 1. The hyperbola can therefore also be defined as the locus of points the ratio of whose distances to the focus and to the directrix is a constant greater than 1. Corresponding to the focus [math](-c, 0)[/math] is a second directrix [math]x = - \frac{a^2}{c}[/math].
Not all hyperbolas with horizontal or vertical axes appear with equations in canonical form. But canonical equations can be found for them by factoring and completing the square.
Example
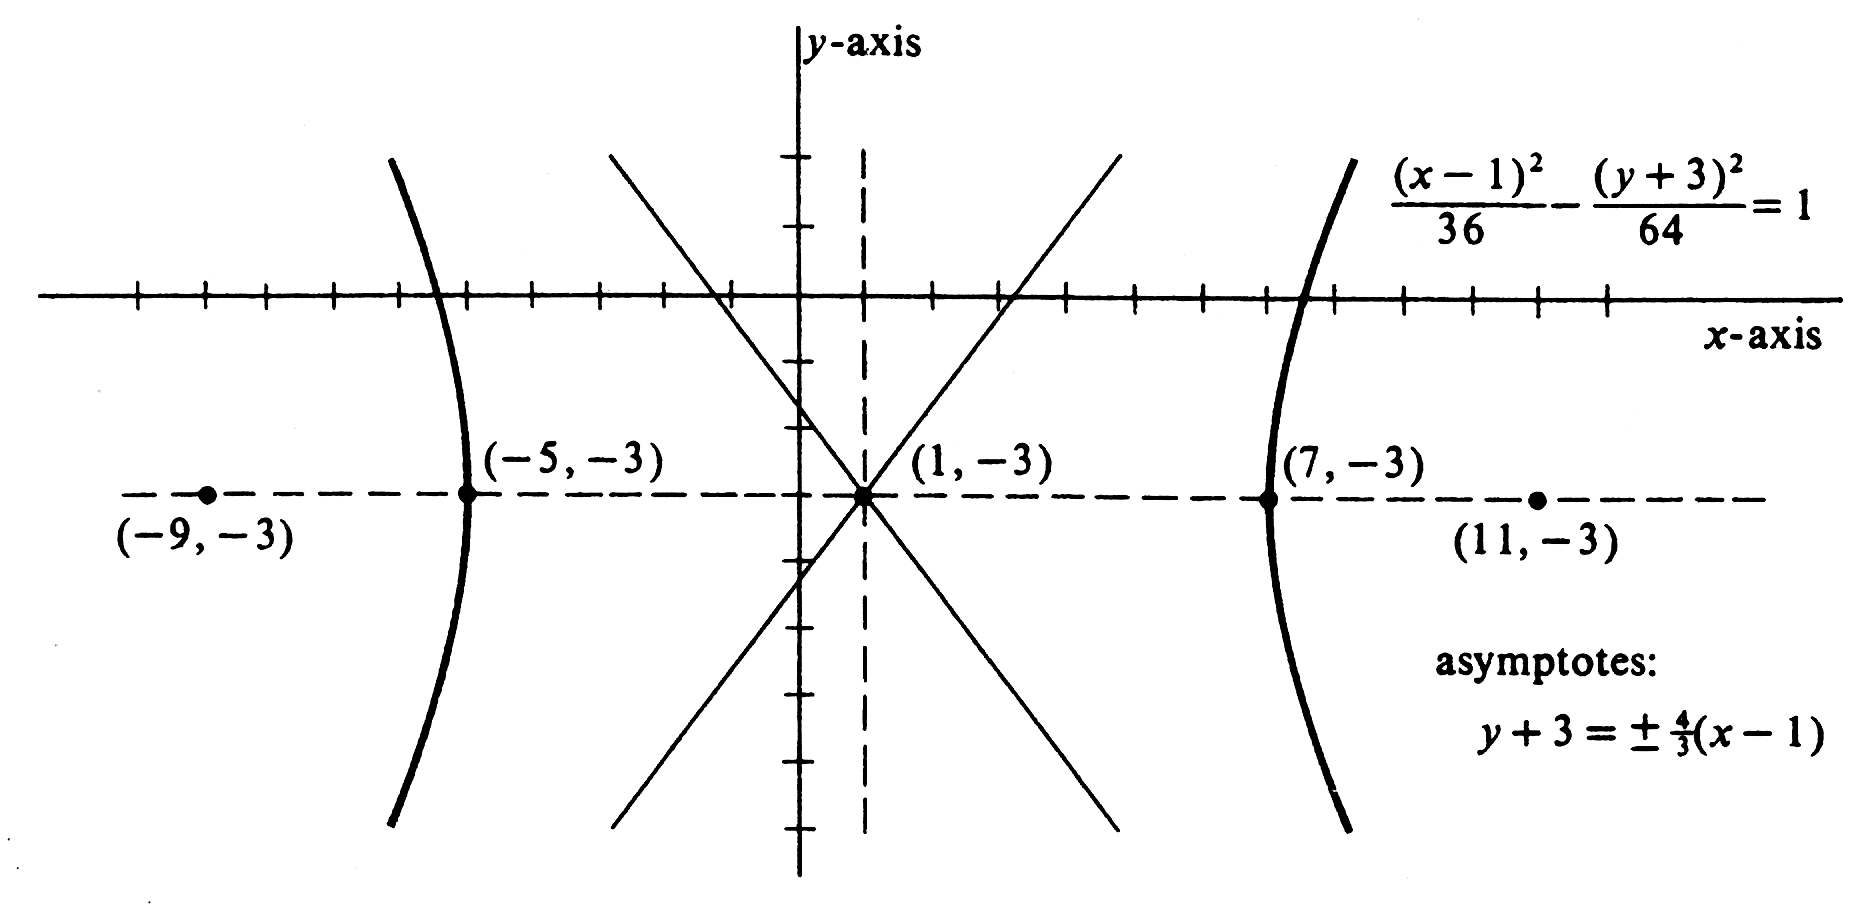
Describe and sketch the graph of [math]16x^2 - 9y^2 - 32x - 54y - 641 = 0[/math]. Equations equivalent to the given equations are
The hyperbola, opening to the right and left, has its center at [math](1, - 3)[/math], its vertices at [math](-5, -3)[/math] and [math](7, -3)[/math], its foci at [math](-9, -3)[/math] and [math](11, -3)[/math], and the lines [math]y + 3 = \frac{4}{3}(x - 1)[/math] and [math]y + 3 = - \frac{4}{3}(x - 1)[/math] for asymptotes. The graph is sketched in Figure.
The method of Example 4 can be used to show that every equation of the type [math]ax^2 - by^2 + cx + dy + e = 0[/math] with [math]ab \gt 0[/math] has for its graph either a hyperbola or a pair of intersecting straight lines. Equivalent to the given equation are
If the expression on the right side of the equation has the same sign as [math]a[/math] and [math]b[/math], the graph is a hyperbola centered at [math]\Bigl( -\frac{c}{2a}, \frac{d}{2b} \Bigr)[/math] opening to the right and to the left. If the expression has sign opposite to [math]a[/math] and [math]b[/math], the graph is a hyperbola centered at [math]\Bigl(-\frac{c}{2a}, \frac{d}{2b}\Bigr)[/math] but opening upward and downward. If the expression is zero, the graph consists of the two straight lines
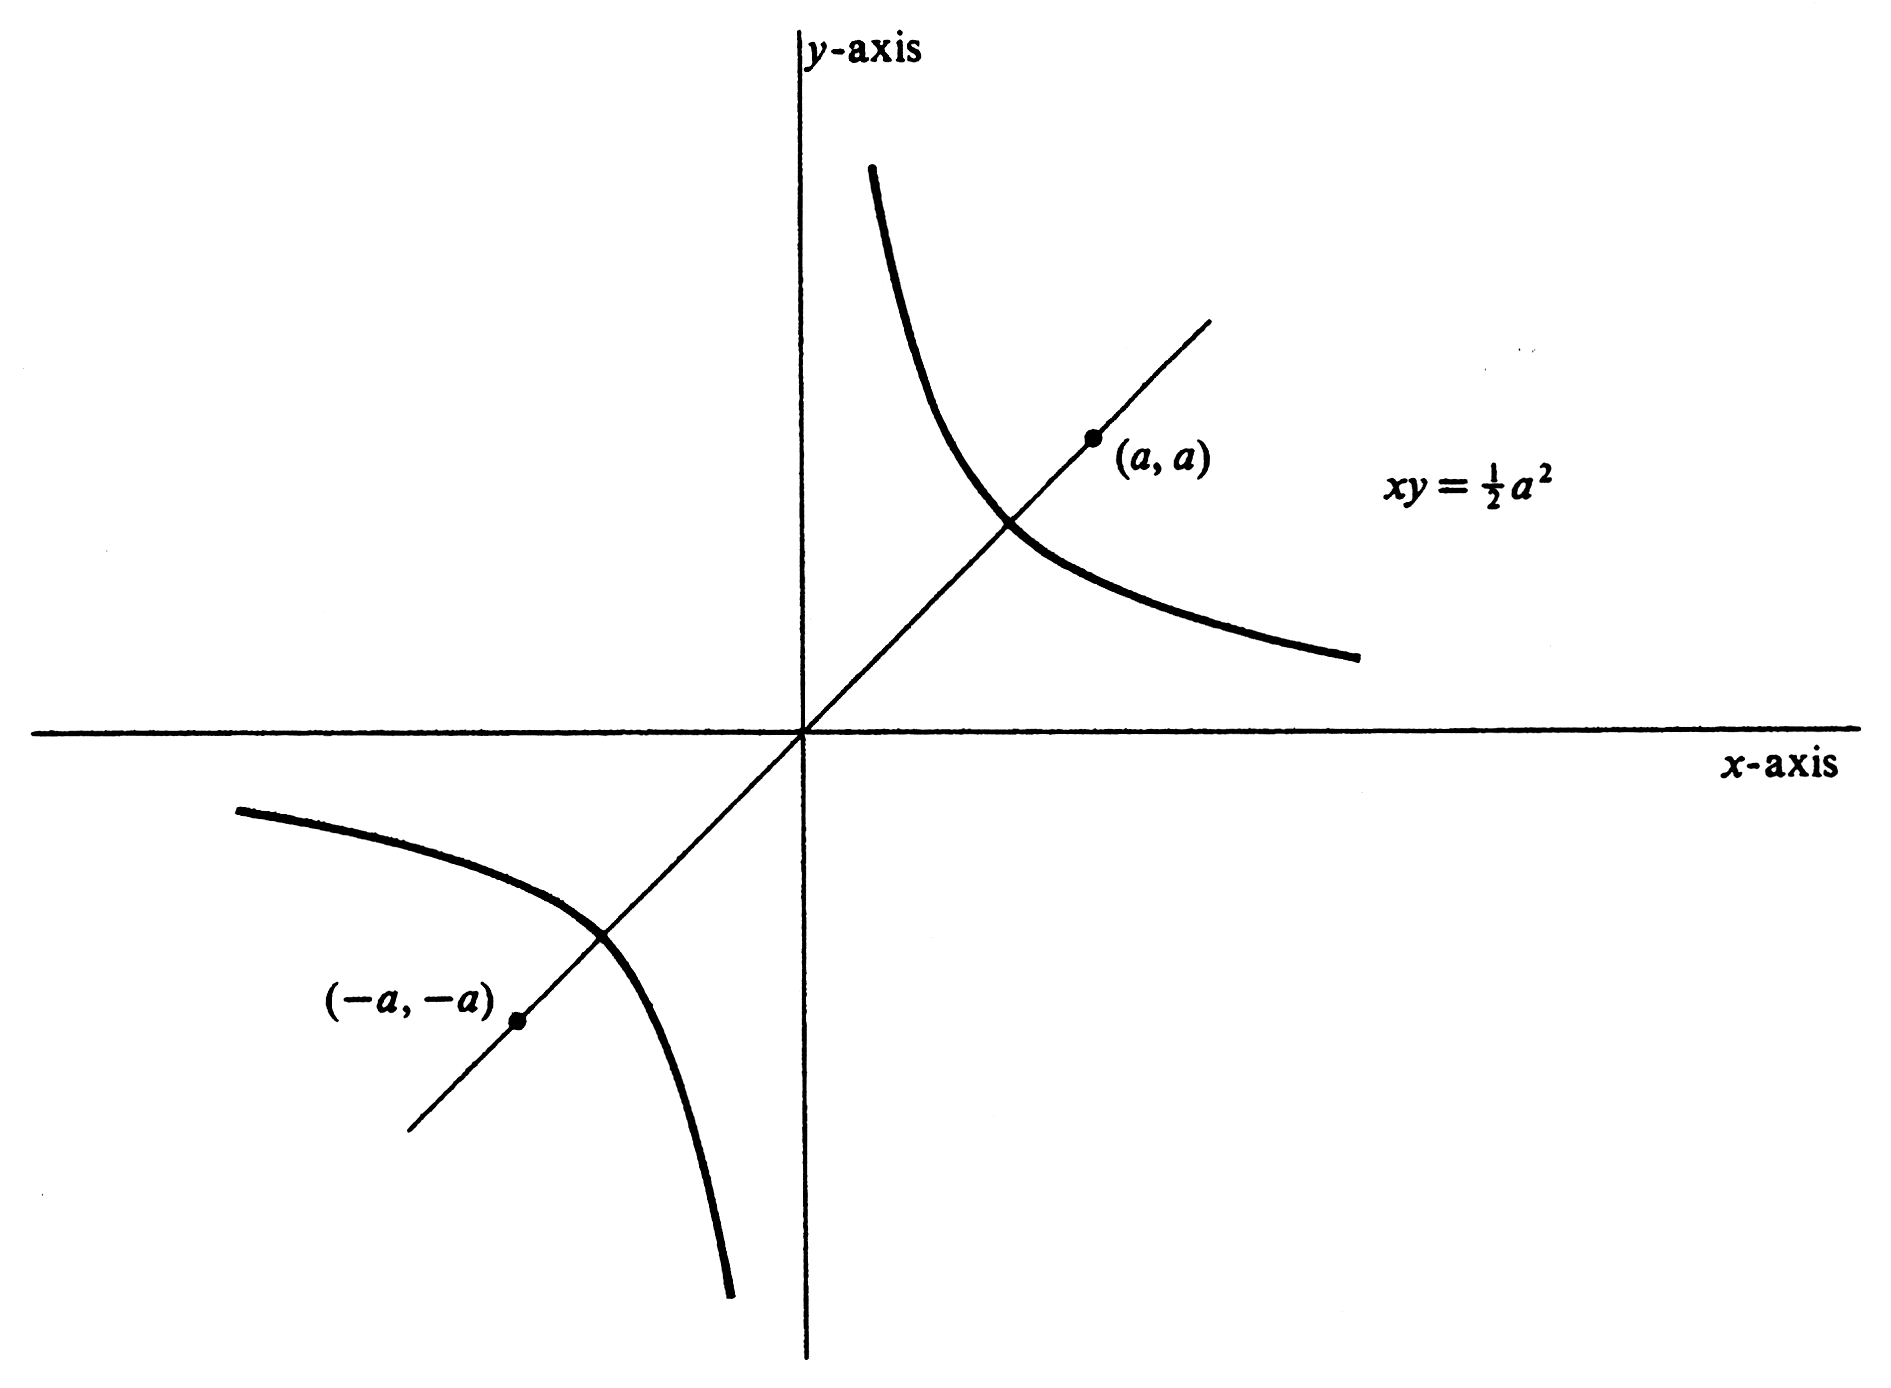
One particular type of hyperbola with its axes neither horizontal nor vertical has a simple equation and appears frequently in mathematics. It is the hyperbola with foci at [math](-a, -a)[/math] and [math](a, a)[/math] and the difference of distances equal to [math]2a[/math]. By definition, a point lies on this hyperbola if and only if
Squarings and simplifications yield the equation
This hyperbola has the coordinate axes for its asymptotes and is drawn in Figure. Its vertices are at [math]\Bigl( -\frac{a}{2}\sqrt{2}, -\frac{a}{2}\sqrt{2} \Bigr)[/math] and [math]\Bigl(\frac{a}{2}\sqrt{2}, \frac{a}{2}\sqrt{2} \Bigr)[/math].
With foci at [math](-a, a)[/math] and [math](a, -a)[/math], the equation is [math]xy = - \frac{1}{2}a^2[/math] and the two branches lie in the second and fourth quadrants. This type of hyperbola is called equilateral, as are the hyperbolas [math]\frac{x^2}{a^2} - \frac{y^2}{b^2} = 1[/math] and [math]\frac{y^2}{a^2} - \frac{x^2}{b^2} = 1[/math] with [math]a^2 = b^2[/math].
General references
Doyle, Peter G. (2008). "Crowell and Slesnick's Calculus with Analytic Geometry" (PDF). Retrieved Oct 29, 2024.
