Revision as of 17:05, 5 May 2023 by Admin (Created page with "'''Solution: E''' The shaded portion of the graph below shows the region over which f(x, y) is nonzero: <div class = "text-center"> File:Examp2023118.jpg </div> We can...")
Exercise
May 05'23
Answer
Solution: E
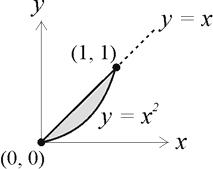
The shaded portion of the graph below shows the region over which f(x, y) is nonzero:
We can infer from the graph that the marginal density function of [math]Y[/math] is given by
[[math]]
g(y) = \int_y^{\sqrt{y}} 15y dx = 15 xy \Big |_y^{\sqrt{y}} = 15y( \sqrt{y} - y ) = 15 y^{3/2}(1-y^{1/2}), \, 0 \lt y \lt 1
[[/math]]
or more precisely,
[[math]]
g(y) = \begin{cases}
15y^{3/2}(1-y)^{1/2}, \quad 0 \lt y \lt 1 \\
0, \quad \textrm{otherwise }
\end{cases}
[[/math]]
