Revision as of 15:09, 7 May 2023 by Admin (Created page with "'''Solution: B''' Let X and Y denote the two bids. Then the graph below illustrates the region over which X and Y differ by less than 20: <div class = "text-center"> File:...")
Exercise
May 07'23
Answer
Solution: B
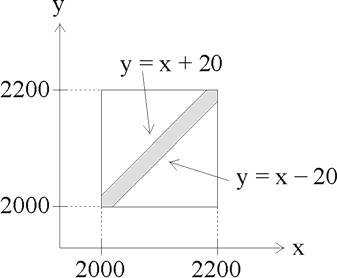
Let X and Y denote the two bids. Then the graph below illustrates the region over which X and Y differ by less than 20:
Based on the graph and the uniform distribution:
[[math]]
\begin{align*}
\operatorname{P}[ |X-Y| \lt 20] &= \frac{\textrm{Shaded Region Area}}{(2200-2000)^2} = \frac{200^2 - 2\frac{1}{2}(180)^2}{200^2} \\
&= 1-\frac{180^2}{200^2} = 1-(0.9)^2 = 0.19.
\end{align*}
[[/math]]
