Exercise
Key: B
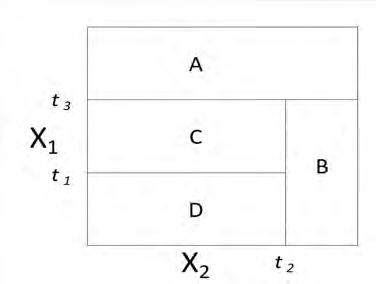
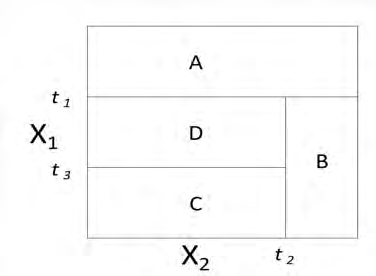
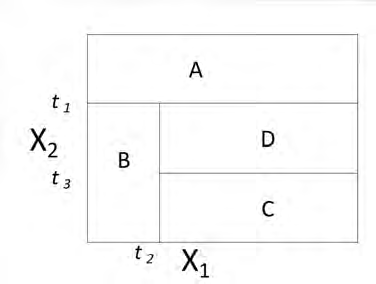
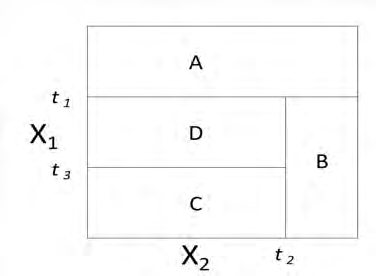
The first split is [math]X_1 \lt t_1[/math]. This requires a horizontal line at [math]t_1[/math] on the vertical axis. Graphs B, C, and E have such a line.
The second split is the case where the first split is true. That means all further action is below the line just described. All three graphs do that. The second split is [math]x_2 \lt t_2.[/math] This requires a vertical line at [math]t_2[/math] on the horizontal axis with the line only going up to [math]t_1.[/math] Again, all three graphs have this.
The third split is when the second split is true. That means all further action is to the left of the line just described. That rules out graph C. The only difference between graphs B and E is which part relates to node C and which to node D. The third split indicates that node C is the case when [math]x_1 \lt t_3.[/math] Only graph B has this region marked as C.


