Exercise
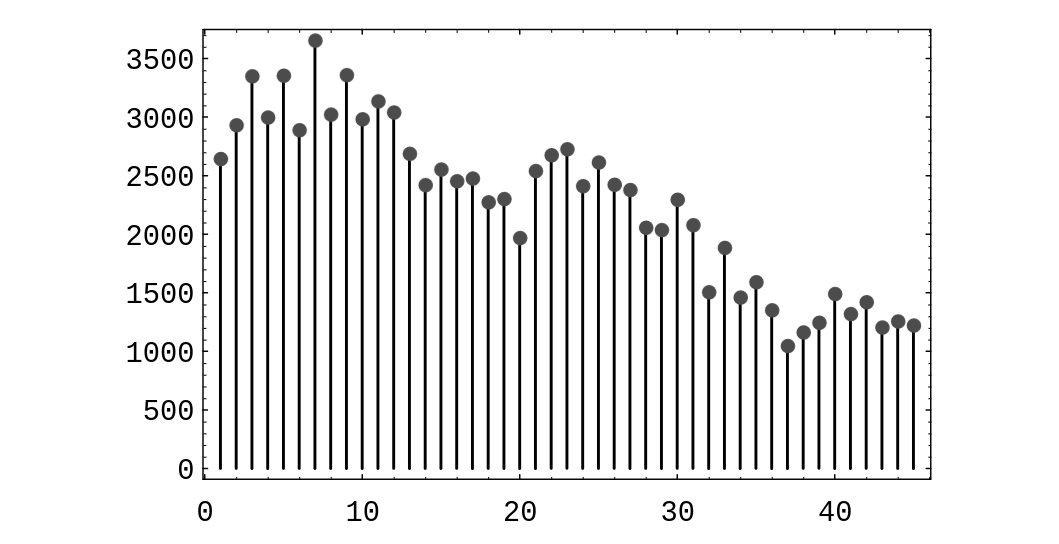
In the Powerball lottery, contestants pick 5 different integers between 1 and 45, and in addition, pick a bonus integer from the same range (the bonus integer can equal one of the first five integers chosen). Some contestants choose the numbers themselves, and others let the computer choose the numbers. The data shown in Table are the contestant-chosen numbers in a certain state on May 3, 1996. A spike graph of the data is shown in Figure.
Do you think that people are choosing numbers randomly? Justify your answer. The goal of this problem is to check the hypothesis that the chosen numbers are uniformly distributed. To do this, compute the value [math]v[/math] of the random variable [math]\chi^2[/math] given in Example. In the present case, this random variable has 44 degrees of freedom. One can find, in a [math]\chi^2[/math] table, the value [math]v_0 = 59.43[/math] , which represents a number with the property that a [math]\chi^2[/math]-distributed random variable takes on values that exceed [math]v_0[/math] only 5% of the time. Does your computed value of [math]v[/math] exceed [math]v_0[/math]? If so, you should reject the hypothesis that the contestants' choices are uniformly distributed.
| Integer | Times Chosen | Integer | Times Chosen | Integer | Times Chosen |
| 1 | 2646 | 2 | 2934 | 3 | 3352 |
| 4 | 3000 | 5 | 3357 | 6 | 2892 |
| 7 | 3657 | 8 | 3025 | 9 | 3362 |
| 10 | 2985 | 11 | 3138 | 12 | 3043 |
| 13 | 2690 | 14 | 2423 | 15 | 2556 |
| 16 | 2456 | 17 | 2479 | 18 | 2276 |
| 19 | 2304 | 20 | 1971 | 21 | 2543 |
| 22 | 2678 | 23 | 2729 | 24 | 2414 |
| 25 | 2616 | 26 | 2426 | 27 | 2381 |
| 28 | 2059 | 29 | 2039 | 30 | 2298 |
| 31 | 2081 | 32 | 1508 | 33 | 1887 |
| 34 | 1463 | 35 | 1594 | 36 | 1354 |
| 37 | 1049 | 38 | 1165 | 39 | 1248 |
| 40 | 1493 | 41 | 1322 | 42 | 1423 |
| 43 | 1207 | 44 | 1259 | 45 | 1224 |
