Write a computer algorithm that simulates a hypergeometric random variable with parameters [math]N[/math], [math]k[/math], and [math]n[/math].
You are presented with four different dice. The first one has two sides marked 0 and four sides marked 4. The second one has a 3 on every side. The third one has a 2 on four sides and a 6 on two sides, and the fourth one has a 1 on three sides and a 5 on three sides. You allow your friend to pick any of the four dice he wishes. Then you pick one of the remaining three and you each roll your die. The person with the largest number showing wins a dollar. Show that you can choose your die so that you have probability 2/3 of winning no matter which die your friend picks. (See Tenney and Foster.[Notes 1])
Notes
The students in a certain class were classified by hair color and eye color. The conventions used were: Brown and black hair were considered dark, and red and blonde hair were considered light; black and brown eyes were considered dark, and blue and green eyes were considered light. They collected the data shown in Table.
| Dark Eyes | Light Eyes | ||
| Dark Hair | 28 | 15 | 43 |
| Light Hair | 9 | 23 | 32 |
| 37 | 38 | 75 |
Are these traits independent? (See Example.)
Suppose that in the hypergeometric distribution, we let [math]N[/math] and [math]k[/math] tend to [math]\infty[/math] in such a way that the ratio [math]k/N[/math] approaches a real number [math]p[/math] between 0 and 1. Show that the hypergeometric distribution tends to the binomial distribution with parameters [math]n[/math] and [math]p[/math].
- Compute the leading digits of the first 100 powers of 2, and see how well these data fit the Benford distribution.
- Multiply each number in the data set of part (a) by 3, and compare the distribution of the leading digits with the Benford distribution.
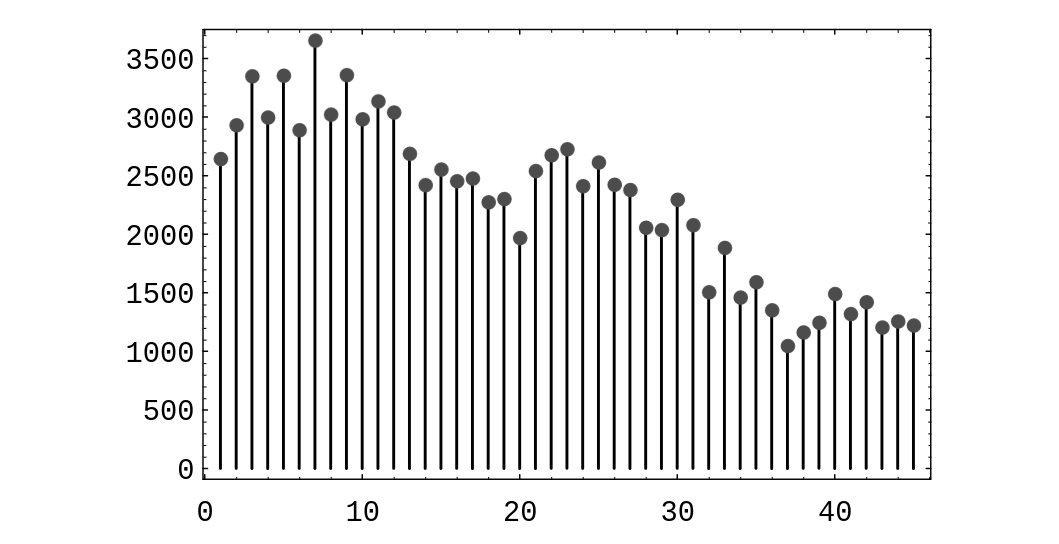
In the Powerball lottery, contestants pick 5 different integers between 1 and 45, and in addition, pick a bonus integer from the same range (the bonus integer can equal one of the first five integers chosen). Some contestants choose the numbers themselves, and others let the computer choose the numbers. The data shown in Table are the contestant-chosen numbers in a certain state on May 3, 1996. A spike graph of the data is shown in Figure.
Do you think that people are choosing numbers randomly? Justify your answer. The goal of this problem is to check the hypothesis that the chosen numbers are uniformly distributed. To do this, compute the value [math]v[/math] of the random variable [math]\chi^2[/math] given in Example. In the present case, this random variable has 44 degrees of freedom. One can find, in a [math]\chi^2[/math] table, the value [math]v_0 = 59.43[/math] , which represents a number with the property that a [math]\chi^2[/math]-distributed random variable takes on values that exceed [math]v_0[/math] only 5% of the time. Does your computed value of [math]v[/math] exceed [math]v_0[/math]? If so, you should reject the hypothesis that the contestants' choices are uniformly distributed.
| Integer | Times Chosen | Integer | Times Chosen | Integer | Times Chosen |
| 1 | 2646 | 2 | 2934 | 3 | 3352 |
| 4 | 3000 | 5 | 3357 | 6 | 2892 |
| 7 | 3657 | 8 | 3025 | 9 | 3362 |
| 10 | 2985 | 11 | 3138 | 12 | 3043 |
| 13 | 2690 | 14 | 2423 | 15 | 2556 |
| 16 | 2456 | 17 | 2479 | 18 | 2276 |
| 19 | 2304 | 20 | 1971 | 21 | 2543 |
| 22 | 2678 | 23 | 2729 | 24 | 2414 |
| 25 | 2616 | 26 | 2426 | 27 | 2381 |
| 28 | 2059 | 29 | 2039 | 30 | 2298 |
| 31 | 2081 | 32 | 1508 | 33 | 1887 |
| 34 | 1463 | 35 | 1594 | 36 | 1354 |
| 37 | 1049 | 38 | 1165 | 39 | 1248 |
| 40 | 1493 | 41 | 1322 | 42 | 1423 |
| 43 | 1207 | 44 | 1259 | 45 | 1224 |
